Summary_code
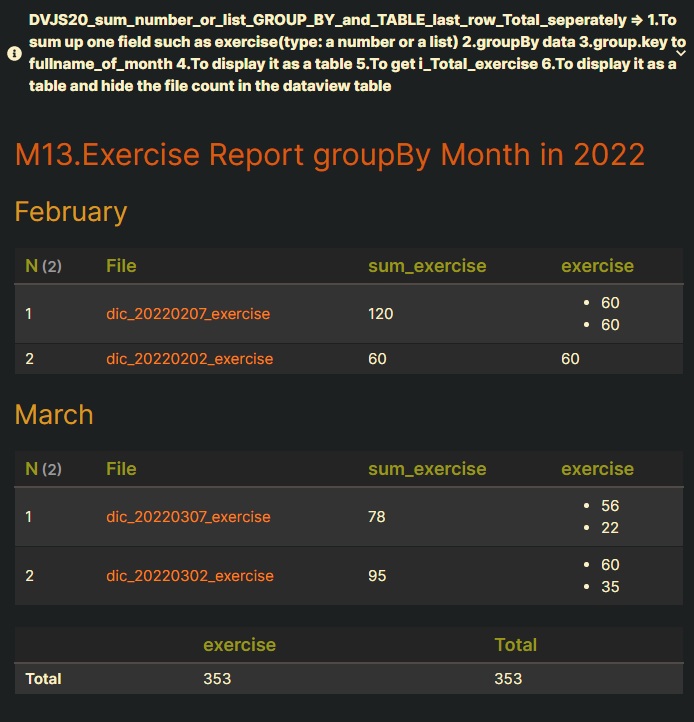
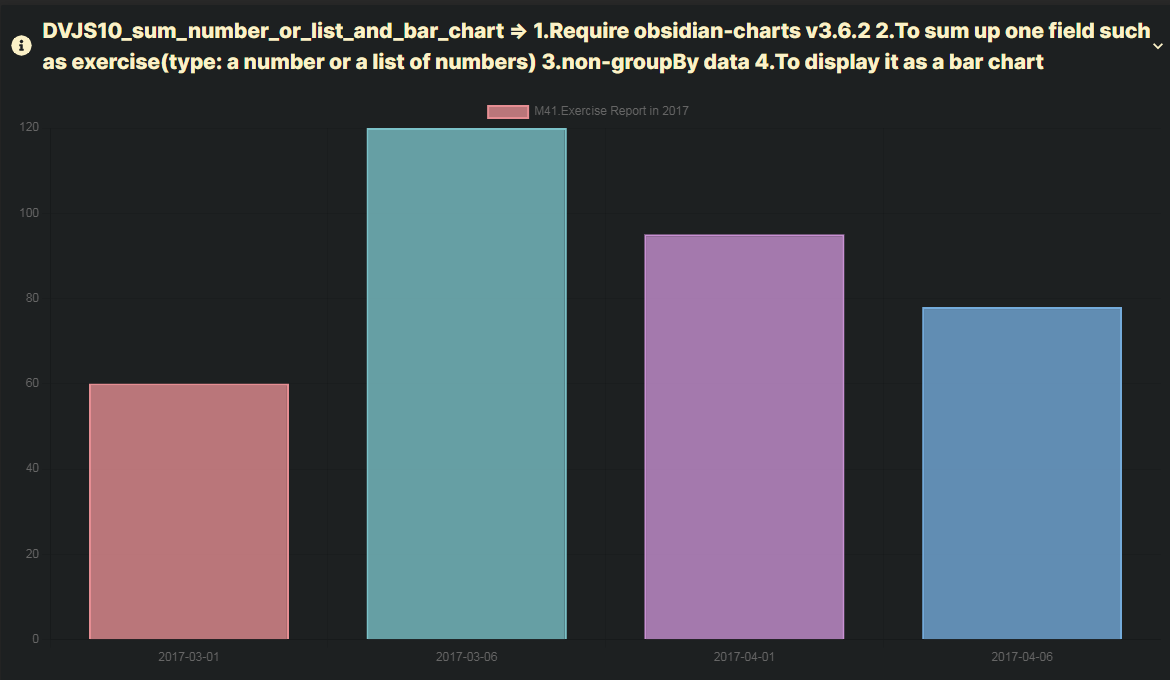
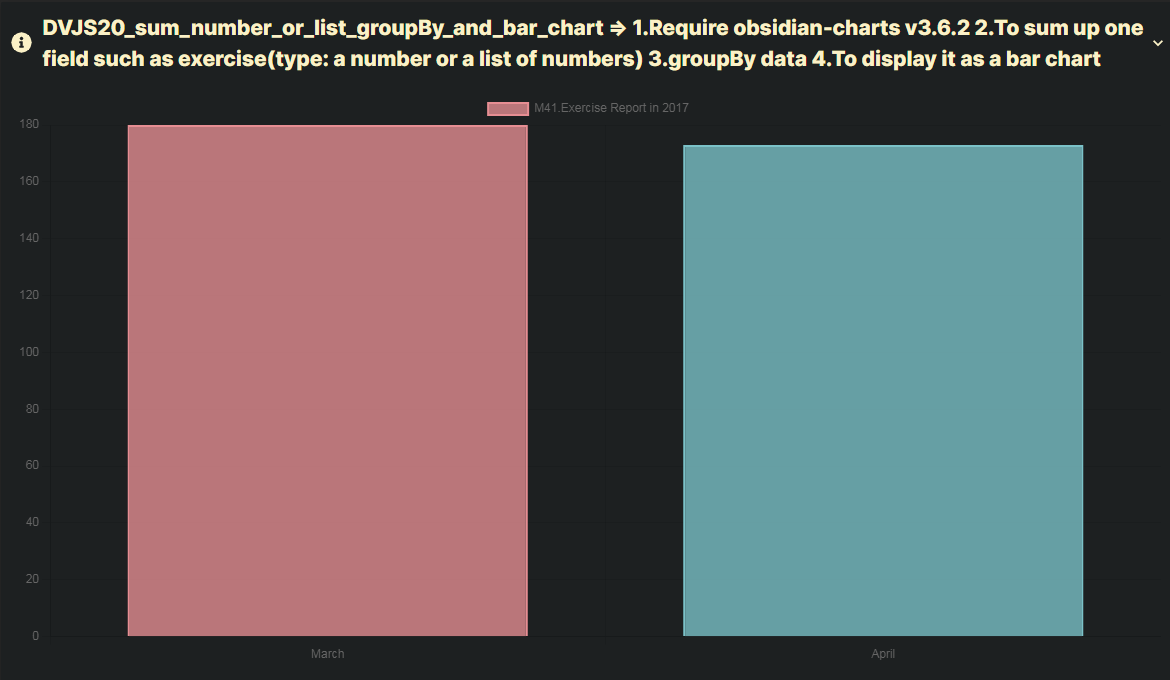
title: DVJS20_sum_number_or_list_groupBy_and_bar_chart => 1.Require obsidian-charts v3.6.2 2.To sum up one field such as exercise(type: a number or a list of numbers) 3.groupBy data 4.To display it as a bar chart
collapse: open
icon:
color:
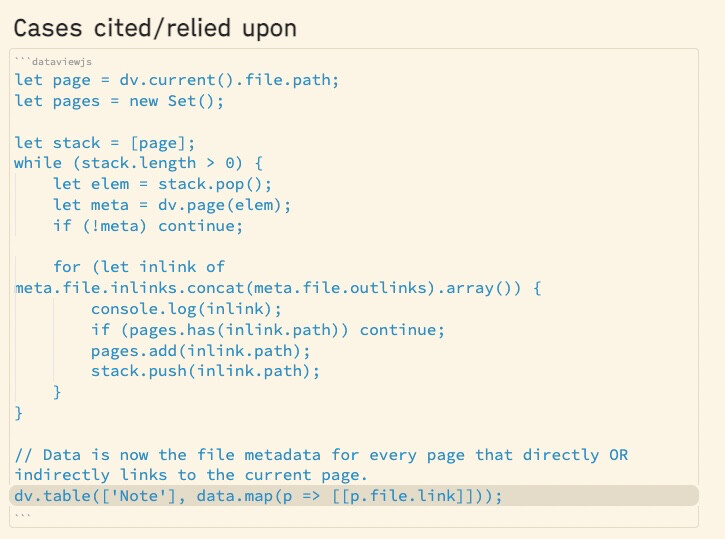
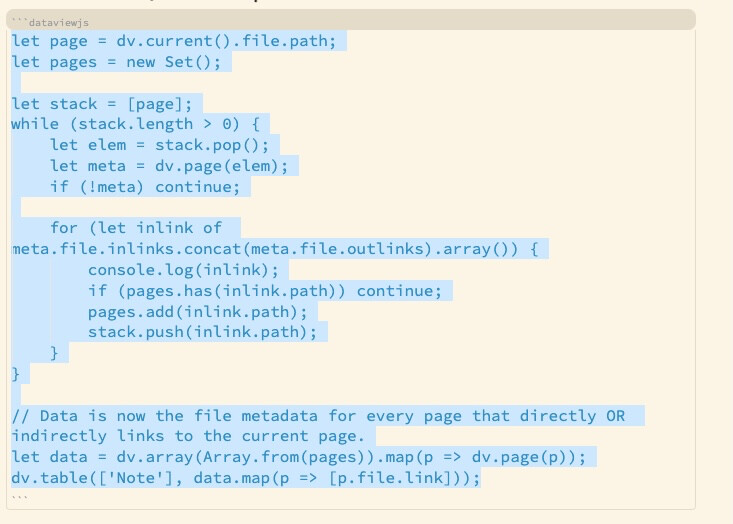
```dataviewjs
// M11. define pages: gather all relevant pages
// #####################################################################
let pages = dv
.pages('"100_Project/02_dataview/Q01_Sum/20220731_Sum_03/Q01_test_data03"')
.where((page) => dv.func.contains(page.file.name, "dic_"))
.where((page) => page.file.name !== dv.current().file.name)
.where((page) => page.exercise)
.where((page) => page.file.day.year === 2017)
.sort((page) => page.file.name, "asc");
// M20. get te counts of unique month: page.file.month ( year = 2022 )
// #####################################################################
let a_unique_months = pages.file.day.month
.where((e) => !(this[e] = e in this))
.sort();
//=>[2, 3]
// M21. define s_label_of_chart for the chart: excel chart title
// ### Used by obsidian-charts v3.6.2 ###
// #######################################################
let s_label_of_chart = "M41.Exercise Report in 2017";
// M23. define a_labels_of_chart for the chart: excel Category X-axis
// ### Used by obsidian-charts v3.6.2 ###
// use .array() to transform a dataview array into a JavaScript array
// dv_array.array() = dv_array.values = dv_array["values"]
// #######################################################
// [page.file.day.month]//=>[2, 3]=> ["February", "March"]
let a_labels_of_chart = [];
a_labels_of_chart = a_unique_months.map(
(e) =>
dv.func.object(
"1","January",
"2","February",
"3","March",
"4","April",
"5","May",
"6","June",
"7","July",
"8","August",
"9","September",
"10","October",
"11","November",
"12","December"
)[dv.func.string(e)]
);
// M24. Define h_month_exercise_YYYYMM: {M: sum(exercise)} ( year = 2022 )
// #####################################################################
let h_month_exercise_YYYYMM = {};
for (let page of pages) {
let s_YYYYMM = page.file.day.toFormat("M");
if (s_YYYYMM in h_month_exercise_YYYYMM) {
h_month_exercise_YYYYMM[s_YYYYMM] += dv.func.sum(page.exercise);
} else {
h_month_exercise_YYYYMM[s_YYYYMM] = dv.func.sum(page.exercise);
}
}
// M24.DEB01 Debug Output: h_month_exercise_YYYYMM
// ######################################################
// The following is the content of the h_month_exercise_YYYYMM.
// {
// "2": 180,
// "3": 173
// }
// M25.define a_data_of_chart for the chart: excel data series
// ### Used by obsidian-charts v3.6.2 ###
// use .array() to transform a dataview array into a JavaScript array
// dv_array.array() = dv_array.values = dv_array["values"]
// #######################################################
//let a_data_of_chart = pages.map((page) => dv.func.sum(page.exercise)).array();
let a_data_of_chart = [];
a_data_of_chart = a_unique_months.map((e) => h_month_exercise_YYYYMM[dv.func.string(e)]).array();
// M25.DEB01 Debug Output: a_data_of_chart
// ######################################################
// The following is the content of the a_data_of_chart.
// [
// 180,
// 173
// ]
// M41.setup the data for the chart: No modification required
// Use PicPick:Color Picker to get rgb: [Color Picker](https://picpick.app/en/)
// #######################################################
const chartData = {
labels: a_labels_of_chart,
datasets: [
{
label: s_label_of_chart,
data: a_data_of_chart,
backgroundColor: [
"rgba(230, 142, 147, 0.786)", //01:orange
"rgba(123, 194, 200, 0.786)", //02:pink greenish
"rgba(202, 145, 212, 0.786)", //03:pink purple
"rgba(116, 171, 219, 0.786)", //04:pink blue
"rgba(229, 168, 116, 0.786)", //05:pink orange
"rgba(104, 103, 172, 0.786)", //06:pink purple 02
"rgba(81, 196, 211, 0.786)", //07:pink greenish 02
],
borderColor: [
"rgba(230, 142, 147, 1.0)", //01:orange
"rgba(123, 194, 200, 1.0)", //02:pink greenish
"rgba(202, 145, 212, 1.0)", //03:pink purple
"rgba(116, 171, 219, 1.0)", //04:pink blue
"rgba(229, 168, 116, 1.0)", //05:pink orange
"rgba(104, 103, 172, 1.0)", //06:pink purple 02
"rgba(81, 196, 211, 1.0)", //07:pink greenish 02
],
borderWidth: 2,
},
],
};
// M43. configure the chart: No modification required
// #######################################################
const config = {
type: "bar",
data: chartData,
};
// M45. render the chart: No modification required
// #######################################################
window.renderChart(config, this.container);
// M91. GROUP BY file.day.month + TABLE :
// #####################################################################
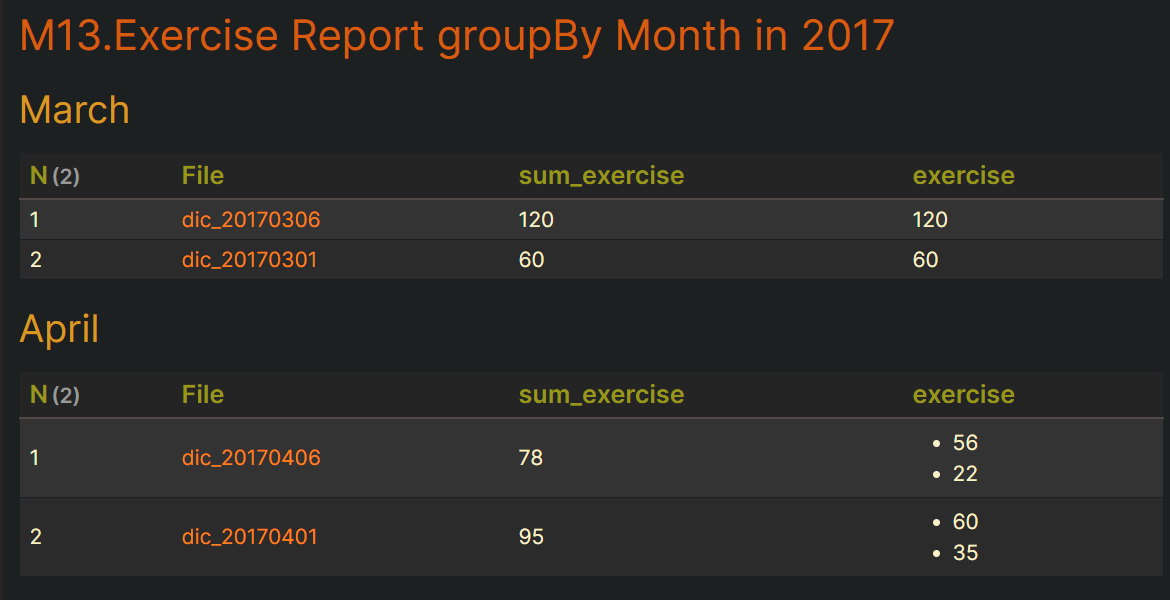
dv.header(2, "M13.Exercise Report groupBy Month in 2017");
for (let group of pages.groupBy((page) => page.file.day.month)) {
//dv.header(3, group.key);
dv.header(3,
{
"1": "January",
"2": "February",
"3": "March",
"4": "April",
"5": "May",
"6": "June",
"7": "July",
"8": "August",
"9": "September",
"10": "October",
"11": "November",
"12": "December"
}[group.key]
);
dv.table(
["N", "File", "sum_exercise", "exercise"],
group.rows
.sort((k) => k.file.name, "desc")
.map((k, index) => [
index + 1,
k.file.link,
dv.func.sum(k.exercise),
k["exercise"],
])
);
}
```