Look at the Q1 and Q2 in the DVJS10 Notes.
Topic
Summary
- How to count one field
needsaccording to its value and display the result as a bar chart?
Test
Summary
- dataview: v0.5.55
- obsidian-charts: v3.6.2
Input
Summary
dictionary files
- Location: “100_Project/01_dataviewjs/01_by_example/Q77_BarChart/Q77_test_data”
folder: 03
- filename :
dic_19590301
```yaml
---
Date: 1959-03-01
class: "feelings"
needs: "undestanding"
---

```
folder: 04
- filename :
dic_19590401
```yaml
---
Date: 1959-04-01
class: "feelings"
needs: "undestanding"
---

```
folder: 05
- filename :
dic_19590501
```yaml
---
Date: 1959-05-01
class: "feelings"
needs: "help"
---

```
folder: 08_null
- filename :
dic_19590801
```yaml
---
Date: 1959-08-01
class: "feelings"
needs:
---

```
folder: 09_undefined
- filename :
dic_19590901
```yaml
---
Date: 1959-09-01
class: "feelings"

---

```
folder: 10_excluded
- filename :
dic_19591001
```yaml
---
Date: 1959-10-01
class: "characteristic"
needs: "undestanding"
---

```
DVJS01_count_string_occurrences_using_DQL_and_bar_chart: using DQL
Summary
Main DVJS
| Code Name | Data type | Group By | Purposes | Remark |
|---|---|---|---|---|
| DVJS01 _count_string_occurrences _using_DQL _and_bar_chart |
needs: a string1.“help” 2.“undestanding” |
no | 1.To run the Q77_DQL01a via dv.query and assign the result to h_result 3.To transform h_result into aoh_target_count 4.To sort the aoh_target_count by needs_QTY in descending order 5.To define Three customizable variables for the chart 6.To display the result as a bar chart |
1.Require obsidian-charts v3.6.2 2.The DVJS01 is based on the DVJS code in the following topic. 2.1 Q78_MediumCat: Part02_mDVJS05 2.2 Q01_Sum: S03_sum_and_bar_chart :DVJS10 |
Code DVJS01_count_string_occurrences_using_DQL_and_bar_chart
Summary_code
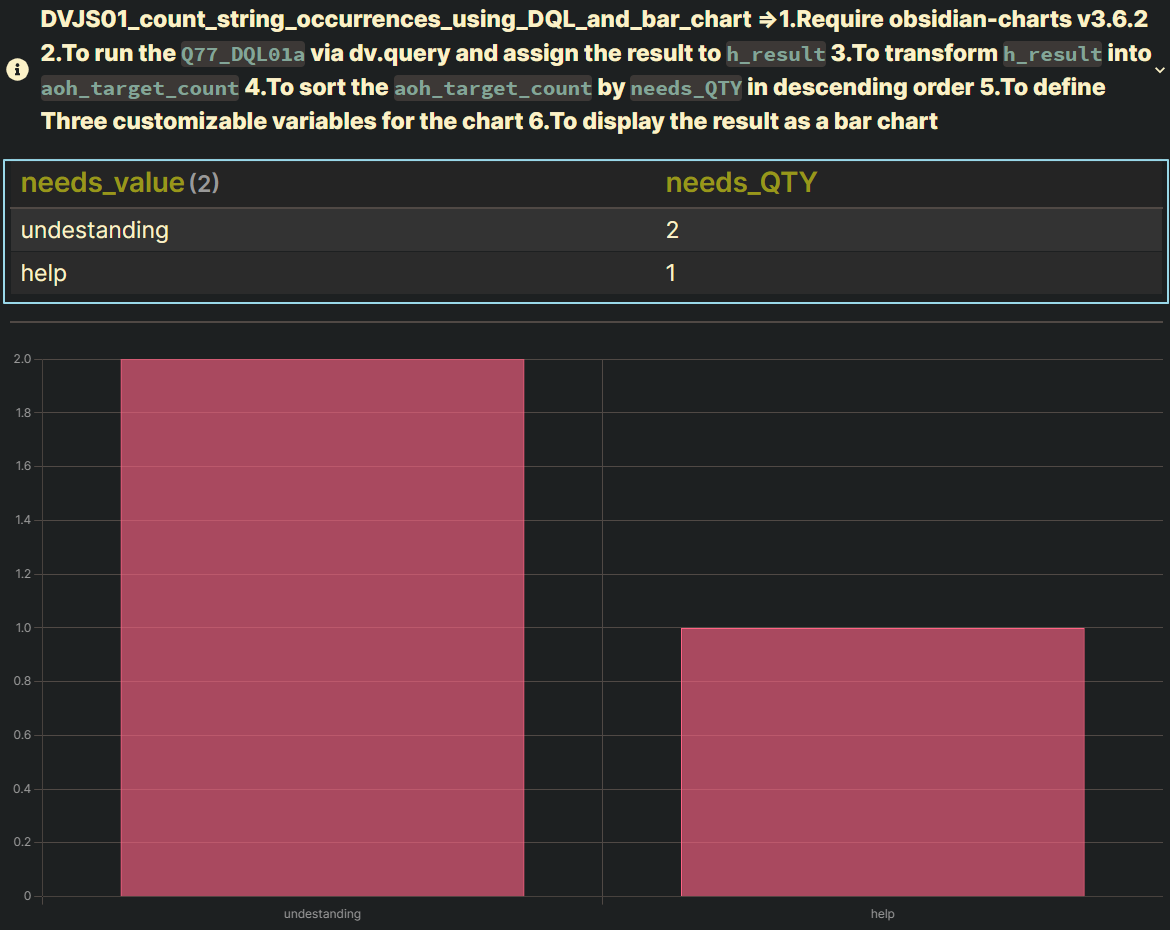
title: DVJS01_count_string_occurrences_using_DQL_and_bar_chart =>1.Require obsidian-charts v3.6.2 2.To run the `Q77_DQL01a` via dv.query and assign the result to `h_result` 3.To transform `h_result` into `aoh_target_count` 4.To sort the `aoh_target_count` by `needs_QTY` in descending order 5.To define Three customizable variables for the chart 6.To display the result as a bar chart
collapse: close
icon:
color:
```dataviewjs
// M11. define Q77_DQL01a:
// #####################################################################
let Q77_DQL01a = `

TABLE WITHOUT ID
      needs_value AS "needs_value",
      needs_QTY AS "needs_QTY"

FROM "100_Project/01_dataviewjs/01_by_example/Q77_BarChart/Q77_test_data"
WHERE class = "feelings"
WHERE needs

GROUP BY needs AS needs_value
FLATTEN length(rows.needs) AS needs_QTY
sort length(rows.needs) DESC

`;


// M20. run the Q77_DQL01a via dv.execute:
// #####################################################################
//dv.execute(Q77_DQL01a);

// M21. define h_result:
// run the Q78_DQL10c via dv.query and assign the result to h_result
// #####################################################################
let h_result = await dv.query(Q77_DQL01a);


// M21.DEB10 debug output:
// #####################################################################
// dv.span(JSON.stringify(h_result, null, 2), "<br>");


// M21.DEB12 debug output:
// #####################################################################
// {
//     value: {
//         type: "table",
//         values: [
//             ["undestanding", 2],
//             ["help", 1],
//         ],
//         headers: ["needs", "count"],
//         idMeaning: {
//             type: "group",
//             name: "G1",
//             on: {
//                 type: "path",
//             },
//         },
//     },
//     successful: true,
// };


// M23. output h_result:
// #####################################################################
if (h_result.successful) {

    // Display the original data according to h_result.value.type
    switch (h_result.value.type) {
        case "table":
            // TABLE:
            dv.table(h_result.value.headers, h_result.value.values);
            dv.span("<hr>");
            break;
        case "list":
            // LIST:
            dv.list(h_result.value.values);
            break;
        case "task":
            // TASK:
            dv.taskList(h_result.value.values);
            break;
        case "calendar":
            // CALENDAR: run a Q78_DQL10c
            dv.execute(Q78_DQL10c);
            break;
        default:
            // do nothing
    }

} else {
    dv.span(h_result.error);
}


// M27. define aoh_target_count:
// transform h_result into aoh_target_count
// #####################################################################
// ######## h_result.value.values:  ########
// [
//     ["undestanding", 2],
//     ["help", 1],
// ]
//
// ######## aoh_target_count:  ########
// [
//     {
//         needs_value: "undestanding",
//         needs_QTY: 2,
//     },
//     {
//         needs_value: "help",
//         needs_QTY: 1,
//     },
// ]
// transform a JavaScript array into a Dataview data array by using dv.array
let aoh_target_count = dv.array([]);
for (let [target, count] of h_result.value.values) {
    aoh_target_count["values"].push({ "needs_value": target, "needs_QTY": count });
}


// M29. sort aoh_target_count: by needs_QTY (DESC)
// #####################################################################
aoh_target_count = aoh_target_count.sort((h) => h.needs_QTY, "desc");


// #######################################################
// #######################################################
// #### Three customizable variables for the chart:
// M31: s_label_of_chart       (excel chart title)
// M33: a_labels_of_chart      (excel Category X-axis)
// M35: a_data_of_chart        (excel data series)
// #######################################################
// #######################################################


// M31. define s_label_of_chart for the chart: excel chart title
// ### Used by obsidian-charts v3.6.2 ###
// #######################################################
let s_label_of_chart = "Needs distribution";


// M33. define a_labels_of_chart for the chart: excel Category X-axis
// ### Used by obsidian-charts v3.6.2 ###
// use .array() to transform a dataview array into a JavaScript array
// dv_array.array() = dv_array.values = dv_array["values"]
// #####################################################################
// let a_labels_of_chart = ["undestanding", "help"];
let a_labels_of_chart = aoh_target_count.map((e) => e.needs_value).array();


// M35.define a_data_of_chart for the chart: excel data series
// ### Used by obsidian-charts v3.6.2 ###
// use .array() to transform a dataview array into a JS array
// dv_array.array() = dv_array.values = dv_array["values"]
// #######################################################
// #####################################################################
// let a_data_of_chart = [2, 1];
let a_data_of_chart = aoh_target_count.map((e) => e.needs_QTY).array();


// M61. define s_CHART_multiline_with_newlines :
// #####################################################################
let s_CHART_multiline_with_newlines = `

\`\`\`chart
    type: bar
    labels: [${a_labels_of_chart}]
    series:
      - title: ${s_label_of_chart}
        data: [${a_data_of_chart}]
    beginAtZero: false
    yMin: 0
    legend: false
    TickDisplay: false
    transparency: 0.618

\`\`\`

`;


// M63. render a bar chart:
// #####################################################################
dv.span(s_CHART_multiline_with_newlines);

```
Screenshots(DVJS01)
DVJS10_count_string_occurrences_using_JavaScript_Objects_and_bar_chart : using JavaScript Objects
Summary
Main DVJS
| Code Name | Data type | Group By | Purposes | Remark |
|---|---|---|---|---|
| DVJS10 _count_string_occurrences _using_JavaScript_Objects _and_bar_chart |
needs: a string1.“help” 2.“undestanding” |
no | 1.To count one field needs(type: a string) according to its value, stored in the h_target_count_of 2.To transform h_target_count_of into aoh_target_count 3.To sort the aoh_target_count by needs_QTY in descending order 4.To display the result as a bar chart |
1.Require obsidian-charts v3.6.2 2.The DVJS10 is based on the DVJS10 in the following topic. - Q82_BarChart: Solutions |
Notes:
Summary
Q1: How to transform the field page.needs into an array if it is a string or an array of strings? (DVJS10:M21)
Summary_Q1
Original Example: Q1 (To be fixed)
```dataviewjs
// M11. define pages: gather all relevant pages
// #####################################################################
let pages = dv
    .pages(
        '"100_Project/01_dataviewjs/01_by_example/Q77_BarChart/Q77_test_data"'
    )
    .where((page) => page.class === "feelings")
    // .where((page) => page.needs);


// M21. count the occurrences of each element
// #####################################################################
let needsCount = {};
pages.forEach((page) => {
    let needs = page.needs;
    if (Array.isArray(needs)) {
        needs.forEach((need) => {
            if (need) {
                needsCount[need] = (needsCount[need] || 0) + 1;
            }
        });
    }
});

```
A1_11:
Another Example: A1_11 (Using a dataview data array)
```dataviewjs
// M21. define needsCount:
// count the occurrences of each element
// #####################################################################
let h_target_count_of = {};
pages.forEach((page) => {

    // M21.FR10 transform note.needs into a dataview data array
    // #################################################################
    let target = dv.array(page.needs);


    // M21.FR20 count the occurrences of each element
    // #################################################################
    target.forEach((need) => {
        if (need) {
            h_target_count_of[need] = (h_target_count_of[need] || 0) + 1;
        }
    });

});

```
A1_12:
Another Example: A1_12 (Using a JavaScript array)
```dataviewjs
// M21. define needsCount:
// count the occurrences of each element
// #####################################################################
let h_target_count_of = {};
pages.forEach((page) => {

    // M21.FR12 transform note.needs into a JavaScript array
    // #################################################################
    let target = page.needs;
    if (dv.func.typeof(page.needs) !== "array") {
        target = [page.needs];
    }


    // M21.FR20 count the occurrences of each element
    // #################################################################
    target.forEach((need) => {
        if (need) {
            h_target_count_of[need] = (h_target_count_of[need] || 0) + 1;
        }
    });
});

```
Q2: How to simplify the following code if the field page.needs is a string? (DVJS10:M21)
Summary_Q2
Original Example: Q2 (To be simplified)
```dataviewjs
// M11. define pages: gather all relevant pages
// #####################################################################
let pages = dv
    .pages(
        '"100_Project/01_dataviewjs/01_by_example/Q77_BarChart/Q77_test_data"'
    )
    .where((page) => page.class === "feelings")
    // .where((page) => page.needs);


// M21. define h_target_count_of: {"undestanding": 2, "help": 1}
// #####################################################################
let h_target_count_of = {};
pages.forEach((page) => {

    // M21.FR10 transform note.needs into a dataview data array
    // #################################################################
    let target = dv.array(page.needs);


    // M21.FR20 count the occurrences of each target
    // #################################################################
    target.forEach((need) => {
        if (need) {
            h_target_count_of[need] = (h_target_count_of[need] || 0) + 1;
        }
    });

});

```
A2_21:
Another Example: A2_21
```dataviewjs
// M21. define h_target_count_of: {"undestanding": 2, "help": 1}
// #####################################################################
let h_target_count_of = {};
pages.forEach((page) => {

    // M21.FR10 define target:
    // #################################################################
    // let target = dv.array(page.needs);
    let target = page.needs;


    // M21.FR20 count the occurrences of each target
    // #################################################################
    // target.forEach((need) => {
    if (target) {
        h_target_count_of[target] = (h_target_count_of[target] || 0) + 1;
    }
    // });
});

```
Code DVJS10_count_string_occurrences_using_JavaScript_Objects_and_bar_chart
Summary_code
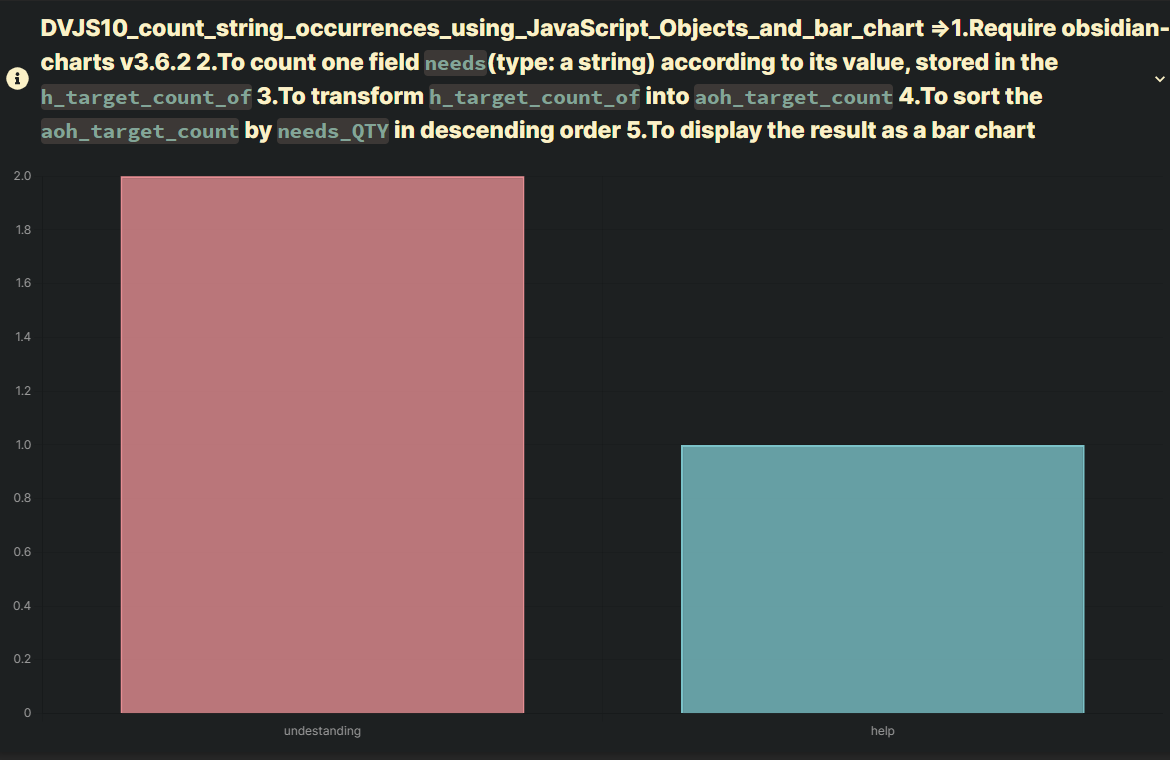
title: DVJS10_count_string_occurrences_using_JavaScript_Objects_and_bar_chart =>1.Require obsidian-charts v3.6.2  2.To count one field `needs`(type: a string) according to its value, stored in the `h_target_count_of`  3.To transform `h_target_count_of` into `aoh_target_count` 4.To sort the `aoh_target_count` by `needs_QTY` in descending order 5.To display the result as a bar chart
collapse: close
icon:
color:
```dataviewjs
// M11. define pages: gather all relevant pages
// #####################################################################
let pages = dv
    .pages(
        '"100_Project/01_dataviewjs/01_by_example/Q77_BarChart/Q77_test_data"'
    )
    .where((page) => page.class === "feelings")
    .where((page) => page.needs);


// M21. define h_target_count_of: {"undestanding": 2, "help": 1}
// #####################################################################
// {
//     undestanding: 2,
//     help: 1,
// }
let h_target_count_of = {};
pages.forEach((page) => {

    // M21.FR10 transform page.needs into a dataview data array
    // #################################################################
    let target = dv.array(page.needs);


    // M21.FR20 count the occurrences of each target
    // #################################################################
    for (let name of target) {
        if (name in h_target_count_of) {
            h_target_count_of[name]++;
        } else {
            h_target_count_of[name] = 1;
        }
    }

});


// M23. define aoh_target_count:
// transform h_target_count_of into aoh_target_count
// #####################################################################
// [
//     {
//         needs_value: "undestanding",
//         needs_QTY: 2,
//     },
//     {
//         needs_value: "help",
//         needs_QTY: 1,
//     },
// ]

// transform a JavaScript array into a Dataview data array by using dv.array
let aoh_target_count = dv.array([]);
for (let [key, value] of Object.entries(h_target_count_of)) {
    aoh_target_count["values"].push({ "needs_value": key, "needs_QTY": value });
}


// M25. sort aoh_target_count: by needs_QTY (DESC)
// #####################################################################
aoh_target_count = aoh_target_count.sort((h) => h.needs_QTY, "desc");


// #######################################################
// #######################################################
// #### Three customizable variables for the chart:
// M31: s_label_of_chart       (excel chart title)
// M33: a_labels_of_chart      (excel Category X-axis)
// M35: a_data_of_chart        (excel data series)
// #######################################################
// #######################################################


// M31. define s_label_of_chart for the chart: excel chart title
// ### Used by obsidian-charts v3.6.2 ###
// #######################################################
let s_label_of_chart = "M45.String occurrences";


// M33. define a_labels_of_chart for the chart: excel Category X-axis
// ### Used by obsidian-charts v3.6.2 ###
// use .array() to transform a dataview array into a JavaScript array
// dv_array.array() = dv_array.values = dv_array["values"]
// #####################################################################
// let a_labels_of_chart = ["undestanding", "help"];
let a_labels_of_chart = aoh_target_count.map((e) => e.needs_value).array();


// M35.define a_data_of_chart for the chart: excel data series
// ### Used by obsidian-charts v3.6.2 ###
// use .array() to transform a dataview array into a JS array
// dv_array.array() = dv_array.values = dv_array["values"]
// #######################################################
// #####################################################################
// let a_data_of_chart = [2, 1];
let a_data_of_chart = aoh_target_count.map((e) => e.needs_QTY).array();


// #######################################################
// #######################################################
// #### No modification required for the chart:
// M41:
// M43:
// M45:
// #######################################################
// #######################################################


// M41. setup the data for the chart: No modification required
// Use PicPick:Color Picker to get rgb: [Color Picker](https://picpick.app/en/)
// #####################################################################
const chartData = {
    labels: a_labels_of_chart,
    datasets: [
        {
            label: s_label_of_chart,
            legend: false,
            data: a_data_of_chart,
            backgroundColor: [
                "rgba(230, 142, 147, 0.786)", //01:orange
                "rgba(123, 194, 200, 0.786)", //02:pink greenish
                "rgba(202, 145, 212, 0.786)", //03:pink purple
                "rgba(116, 171, 219, 0.786)", //04:pink blue
                "rgba(229, 168, 116, 0.786)", //05:pink orange
                "rgba(104, 103, 172, 0.786)", //06:pink purple 02
                "rgba(81, 196, 211, 0.786)",  //07:pink greenish 02

            ],
            borderColor: [
                "rgba(230, 142, 147, 1.0)", //01:orange
                "rgba(123, 194, 200, 1.0)", //02:pink greenish
                "rgba(202, 145, 212, 1.0)", //03:pink purple
                "rgba(116, 171, 219, 1.0)", //04:pink blue
                "rgba(229, 168, 116, 1.0)", //05:pink orange
                "rgba(104, 103, 172, 1.0)", //06:pink purple 02
                "rgba(81, 196, 211, 1.0)",  //07:pink greenish 02

            ],
            borderWidth: 2,
        },
    ],
};


// M43. configure the chart: No modification required
// false => Hide the chart title (s_label_of_chart)
// true  => Show the chart title (s_label_of_chart)
// #####################################################################
const config = {
    type: "bar",
    data: chartData,
    options: {
        plugins: {
            legend: {
                display: false,
            },
        },
    },
};


// M45. render the chart: No modification required
// #####################################################################
window.renderChart(config, this.container);

```
Screenshots(DVJS10)
Reference
Summary
Q01_Sum: S03_sum_and_bar_chart
- Q01_Sum: S03_sum_and_bar_chart:20220731_Solutions
Q82_BarChart
- Q82_BarChart: Solutions
Q79_Push: dv.array()
- Q79_Push: Solutions
Q78_MediumCat : mDVJS05
- Q78_MediumCat:Part02