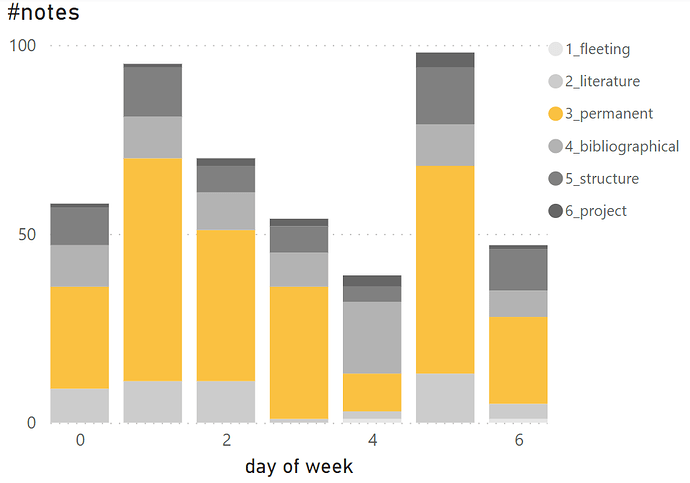
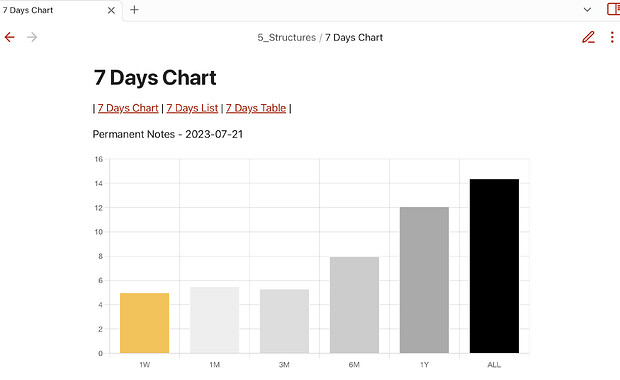
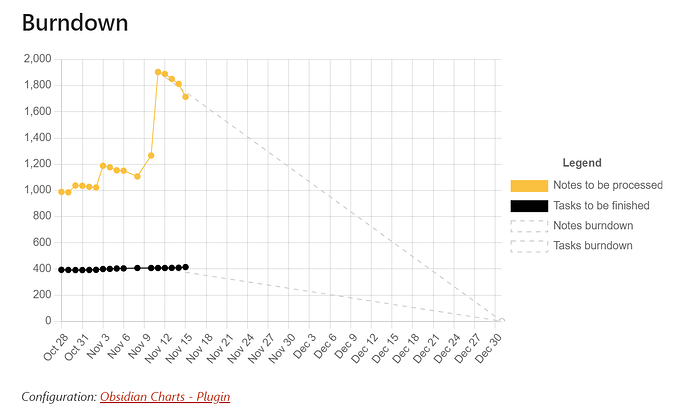
Here’s my latest chart to inspect the progress of my Zettelkasten. It shows the number of notes created within 7 days. You are able to compare the changes for the averages from last week 1W, last month 1M, three month 3M, etc.
All you need is DataView and the Obsidian Charts plugin.
// === 7 Days Chart ===

// --- Age ---
var first_note = "20220307";
var a = moment();
var b = moment(first_note);
var age_years = a.diff(b, 'years');
var age_month = a.diff(b, 'months');
var age_weeks = a.diff(b, 'weeks')
var age_days = a.diff(b, 'days');
var age = a.diff(b, 'days') - 365 * age_years;

// --- Last 7 Days ---
var a = moment().format("YYYY-MM-DD");

var b = moment().subtract(1, 'week');
b = moment(b).format("YYYY-MM-DD");

var c = moment().subtract(1, 'month');
c = moment(c).format("YYYY-MM-DD");

var d = moment().subtract(3, 'month');
d = moment(d).format("YYYY-MM-DD");

var e = moment().subtract(6, 'month');
e = moment(e).format("YYYY-MM-DD");

var f = moment().subtract(1, 'year');
f = moment(f).format("YYYY-MM-DD");

// —— Last 1 Week —-
var count_note_1w = dv
	.pages('"3_Permanent Notes"')
	.where (p => p.created >= b)
	.length;

// —— Last 1 Month —-
var count_note_1m = dv
	.pages('"3_Permanent Notes"')
	.where (p => p.created >= c)
	.length;
var count_note_1m_13 = count_note_1m / 52 * 12;
count_note_1m_13 = count_note_1m_13.toFixed(1);

// —— Last 3 Month —-
var count_note_3m = dv
	.pages('"3_Permanent Notes"')
	.where (p => p.created >= d)
	.length;
var count_note_3m_13 = count_note_3m / 13;
count_note_3m_13 = count_note_3m_13.toFixed(1);

// —— Last 6 Month —-
var count_note_6m = dv
	.pages('"3_Permanent Notes"')
	.where (p => p.created >= e)
	.length;
var count_note_6m_26 = count_note_6m / 26;
count_note_6m_26 = count_note_6m_26.toFixed(1);

// —— Last 1 Year —-
var count_note_1Y= dv
	.pages('"3_Permanent Notes"')
	.where (p => p.created >= f)
	.length;
var count_note_1Y_52 = count_note_1Y / 52;
count_note_1Y_52 = count_note_1Y_52.toFixed(1);

// —- Since Start
var count_note_all = dv
	.pages('"3_Permanent Notes"')
	.length;

var note_per_week = count_note_all / age_weeks;
note_per_week = note_per_week.toFixed(1);

// --- show results ---
dv.paragraph('Permanent Notes per Week - ' + a);

// --- Set Colors ---
const CHART_COLORS = {
	  red: '#B51A00',
	  orange: 'rgb(255, 159, 64)',
	  yellow: '#FAC141',
	  green: 'rgb(75, 192, 192)',
	  blue: '#417CFA',
	  black: '#000000',
	  grey: '#CCCCCC',
	  light_grey: '#DDDDDD',
	  ultralight_grey: '#EEEEEE',
	  dark_grey: '#AAAAAA',
	  white: '#FFFFFF'
	}

const NAMED_COLORS = [
	  CHART_COLORS.red,
	  CHART_COLORS.orange,
	  CHART_COLORS.yellow,
	  CHART_COLORS.green,
	  CHART_COLORS.blue,
	  CHART_COLORS.purple,
	  CHART_COLORS.grey,
	]

// --- Create Chart ---
const chartData = {
	type: 'bar',
	data: {
		labels: [
			'1W',
			'1M',
			'3M',
			'6M',
			'1Y',
			'ALL'],
		datasets: [
			{
			label: 'y',
			data: [count_note_1w, count_note_1m_13, count_note_3m_13,
				count_note_6m_26, count_note_1Y_52, note_per_week],
			backgroundColor: [
				CHART_COLORS.yellow,
				CHART_COLORS.ultralight_grey, CHART_COLORS.light_grey,
				CHART_COLORS.grey, CHART_COLORS.dark_grey, CHART_COLORS.black],
			borderColor: CHART_COLORS.white,
			borderWidth: 1
			}
		]
	},
	options: {
		indexAxis: 'x',
        plugins: {
            title: {
                display: false,
                text: 'Custom Chart Title'
            },
            subtitle: {
                display: false,
                text: 'Custom Chart Subtitle'
            },
            legend: {
	            display: false,
                position: 'right'
            }
        }
    }

}

window.renderChart(chartData, this.container)
