@scholarInTraining Thank you so much for your continued help. I really appreciate it. These charts are exactly the type I could love to create. However, I want to load data from the markdown files in my vault. It looks like @metawops is loading data from a local JSON file. Especially I want to “Select Sum(Calorie) as CalorieTotal from all my MD Files Group by date.” Then have the types of charts @metawops had developed. That would be so wonderful. If you have any other ideas please let me know. Thank you, so much @scholarInTraining
3 Likes
@metawops any idea how to do what @snowbiker100 asked here?
Hi @snowbiker100,
can you be a bit more precise on what exactly you want to visualize here?
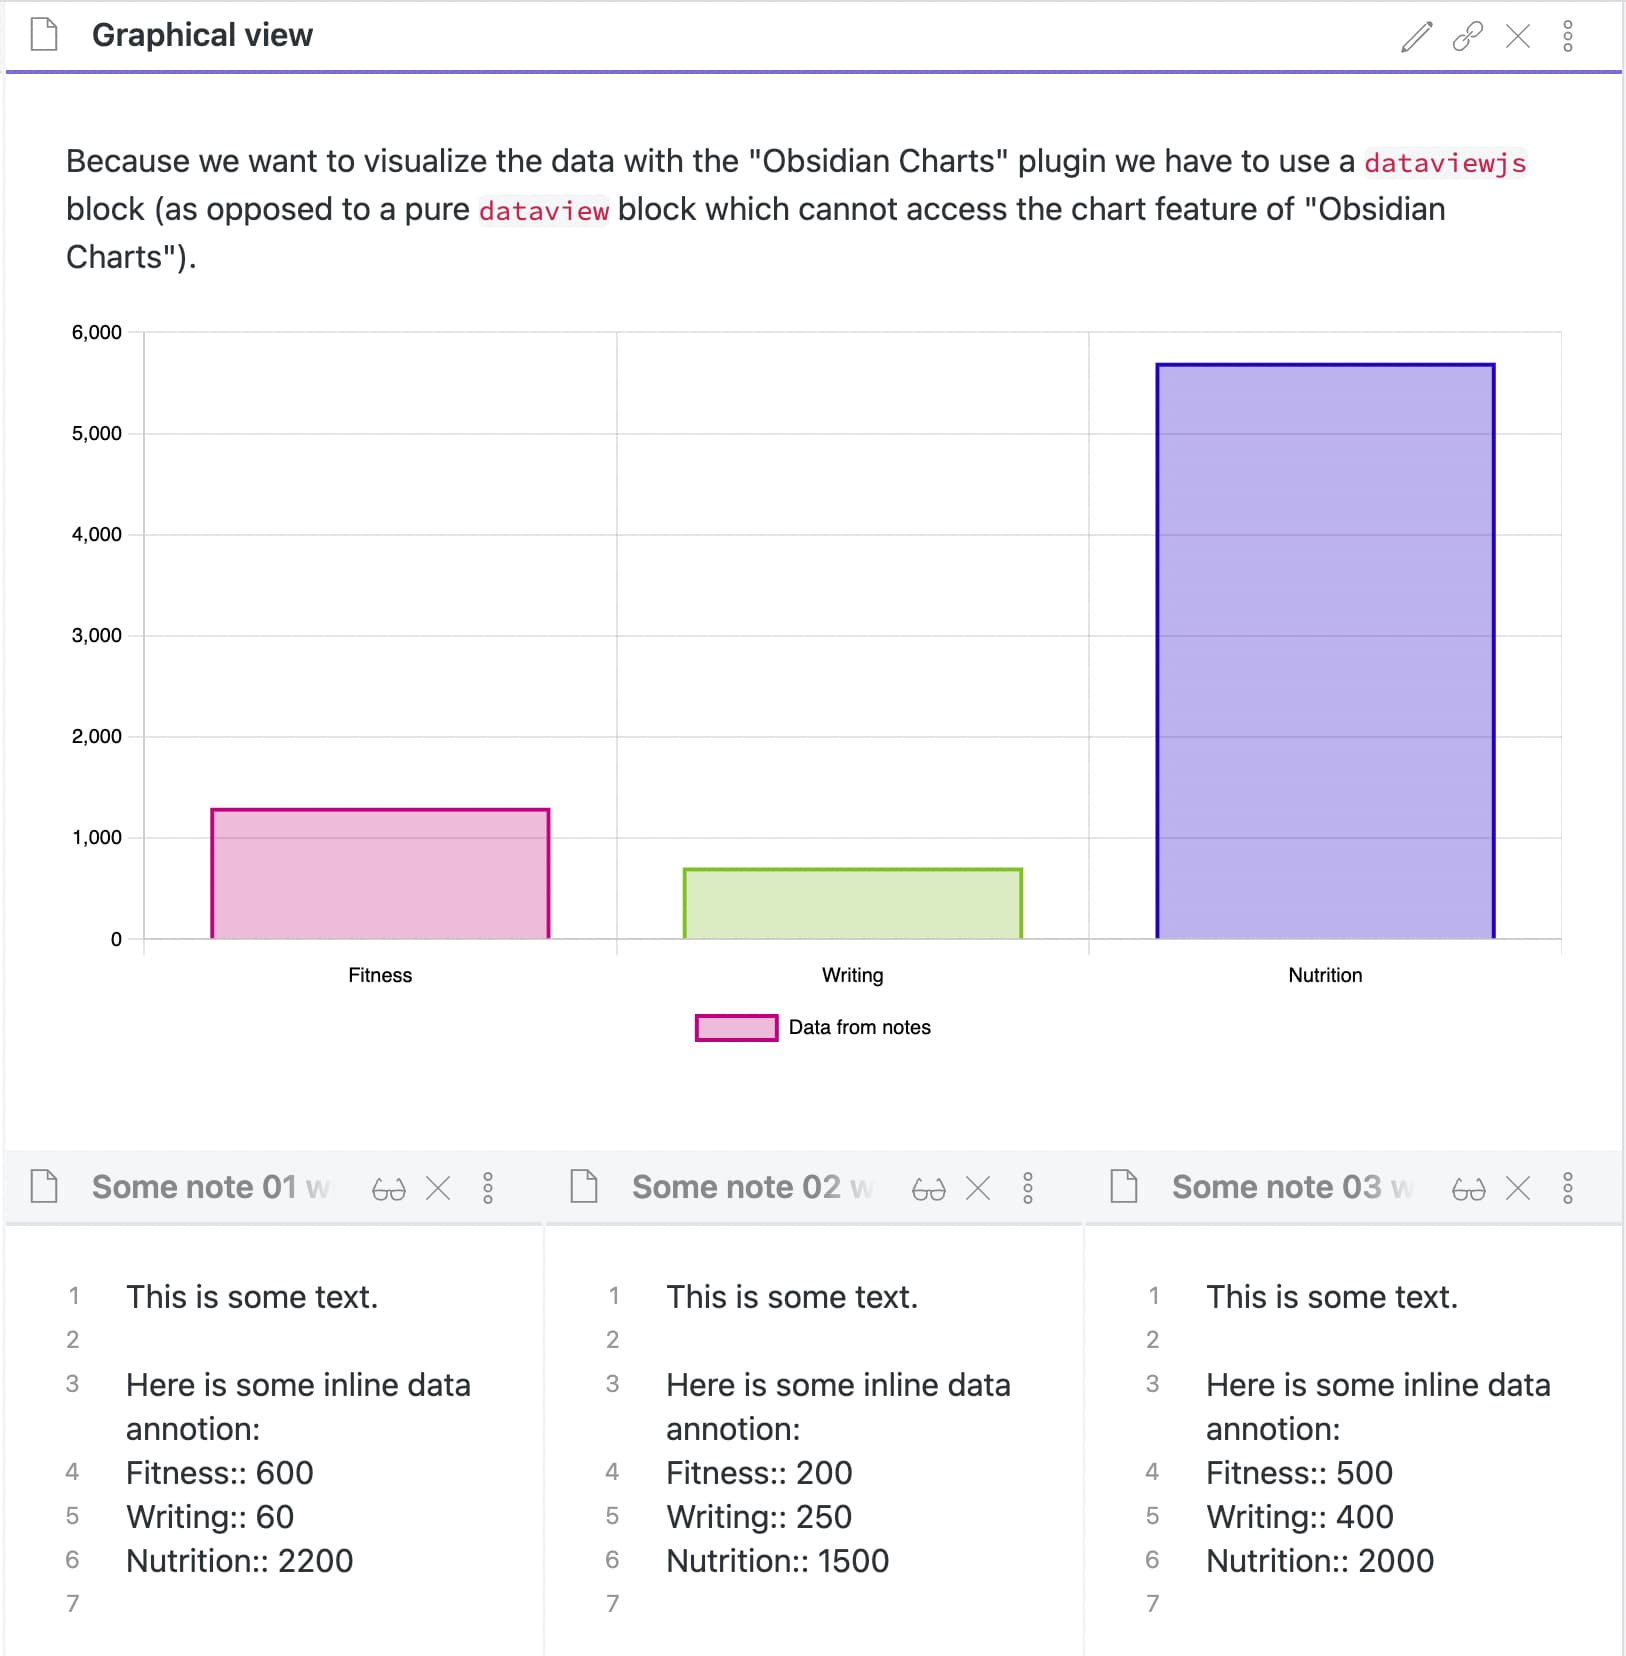
Are those bars representing a data category like „Fitness“, „Writing“ and „Nutrition“ and the height of the bars is the sum of those individual values?
Or … do you want the time on the x-axis and see the the values of those categories over time, for each day, for example?
And how are these data category values embedded inside your notes? Can you provide an example? The double colon notation suggests you‘re using Dataview‘s inline type of data encoding, right? So, not in a note‘s front matter YAML block?
1 Like
Sorry, should have included the link to the earlier post in this thread with some of those answers.
Yes, I saw that but it nevertheless leads me to those questions.
But I’ll assume something and see what I can come up with … ![]()
2 Likes
Well, here’s a start I was able to come up with quickly for @snowbiker100.
I know it’s not exactly what you want but at least it shows you to read out the data values of all notes in one particular folder. I know that you want to have different coloured bars but let’s that postpone to later for now. Is this going in the right direction, @snowbiker100?
Here’s a screenshot:

Note that because the sum of the Nutrition values is much higher than the sums of the Fitness and Writing data the bars are so different in height … ![]()
2 Likes
Hi Everyone,
Hoping someone here can help me with something I’m trying to achieve.
To give a little bit of context, I capture all my tasks in my daily note and have metadata for each task - 1. “r” - related and 2. due. and I’m trying to create a task list for all things due today and group them by the ‘related’ project/kind of task.
Task capture in Daily notes as such
[ ] Task 1 [r:: [[Project A]] ] [due:: 2022-07-17]
[ ] Task 2 [r:: [[Project A]] ] [due:: 2022-07-17]
[ ] Task 3 [r:: [[Project B]] ] [due:: 2022-07-17]
[ ] Task 4 [r:: Test] [due:: 2022-07-17]
[ ] Task 5 [r:: Test] [due:: 2022-07-17]
Desired result in Task List
## [[Project A]]
[ ] Task 1 [r:: [[Project A]] ] [due:: 2022-07-17]
[ ] Task 2 [r:: [[Project A]] ] [due:: 2022-07-17]

## [[Project B]]
[ ] Task 3 [r:: [[Project B]] ] [due:: 2022-07-17]

## Test
[ ] Task 4 [r:: Test] [due:: 2022-07-17]
[ ] Task 5 [r:: Test] [due:: 2022-07-17]
With a lot of trial and error, I’ve come to this point where, I can find all tasks due today, and create H2 headings for each ‘related’ project/kind of task but for tasks with a r:: link to a file, I only get one task not all tasks.
My code snippet

var n = luxon.DateTime.now()
for (let related of dv.pages(-'"/Journal/Daily"').file.tasks.filter(t => t.due && Math.floor(n.diff(t.due,'days').days) == 0 &&!t.completed).groupBy(t => t.r))
{
  dv.header(2,related.key);
  dv.taskList(dv.pages(-'"/Journal/Daily"').file.tasks.filter(t => t.due && Math.floor(n.diff(t.due,'days').days) == 0 && t.r == related.key && !t.completed),false)
}
Achieved result in Task List with missing Task2
## [[Project A]]
[ ] Task 1 [r:: [[Project A]] ] [due:: 2022-07-17]

## [[Project B]]
[ ] Task 3 [r:: [[Project B]] ] [due:: 2022-07-17]

## Test
[ ] Task 4 [r:: Test] [due:: 2022-07-17]
[ ] Task 5 [r:: Test] [due:: 2022-07-17]
Instead of doing a second query to generate the content for your taskList inside the loop, can you just use related.rows? The first example on the DVJS Codeblock Examples page seems potentially useful.
1 Like
Topic
Summary
- How to find the bug from the
DVJS10_bug_Tasks_groupBy_r? - How to group the data by
rwhich is a link like [[Project A]] or a string like “Test”?
Test
Summary
- dataview: v0.5.46
Input
Summary
dictionary files
- Location: “100_Project/01_dataviewjs/01_by_example/Q13_Tasks_groupBy/Q13_test_data”
folder: 02
- filename :
dic_20220206
---
Date: 2022-02-06
---
# Daily notes
- [ ] Task 1 [r:: [[Project A]] ] [due:: 2022-07-18]
- [ ] Task 2 [r:: [[Project A]] ] [due:: 2022-07-18]
- [ ] Task 3 [r:: [[Project B]] ] [due:: 2022-07-18]
- [ ] Task 4 [r:: Test] [due:: 2022-07-18]
- [ ] Task 5 [r:: Test] [due:: 2022-07-18]
- [ ] Task 6 [r:: Test123] [due:: 2022-07-18]
- [ ] Task 7 [r:: Test123] [due:: 2022-07-18]
- [ ] Task 8 [r:: Test456] [due:: 2022-07-18]
- [ ] Task 9 [r:: Test456] [due:: 2022-07-18]
DQL10_use_fTasks_and_get_uncompleted_and_overdue_tasks_and_groupBy_r
Summary
Main DQL
| Code Name | Data type | Group By | Purposes | Remark |
|---|---|---|---|---|
| DQL10 _use_fTasks _and_get _uncompleted_and_overdue_tasks _and_groupBy_r |
flattened file.tasks | yes | 1.To filter by due 2.To filter by uncompleted task 3.To define a field variable TODAY_MINUS_DUE by using FLATTEN 4.To filter by TODAY_MINUS_DUE 5.To display the result as a TaskList |
1.The DQL10 is the same as the DVJS40 in the topic. |
Code DQL10_use_fTasks_and_get_uncompleted_and_overdue_tasks_and_groupBy_r
Summary_code
title: DQL10_use_fTasks_and_get_uncompleted_and_overdue_tasks_and_groupBy_r =>1.To filter by `due` 2.To filter by uncompleted task 3.To define a field variable `TODAY_MINUS_DUE` by using FLATTEN 4.To filter by `TODAY_MINUS_DUE` 5.To display the result as a TaskList
collapse: close
icon:
color:
```dataview
Task
FROM "100_Project/01_dataviewjs/01_by_example/Q13_Tasks_groupBy/Q13_test_data"

WHERE due
WHERE !completed

FLATTEN date("today") - due AS TODAY_MINUS_DUE
WHERE TODAY_MINUS_DUE <= dur("36500 days") AND TODAY_MINUS_DUE >= dur("0 days")

GROUP BY r
```
Screenshots(DQL10)

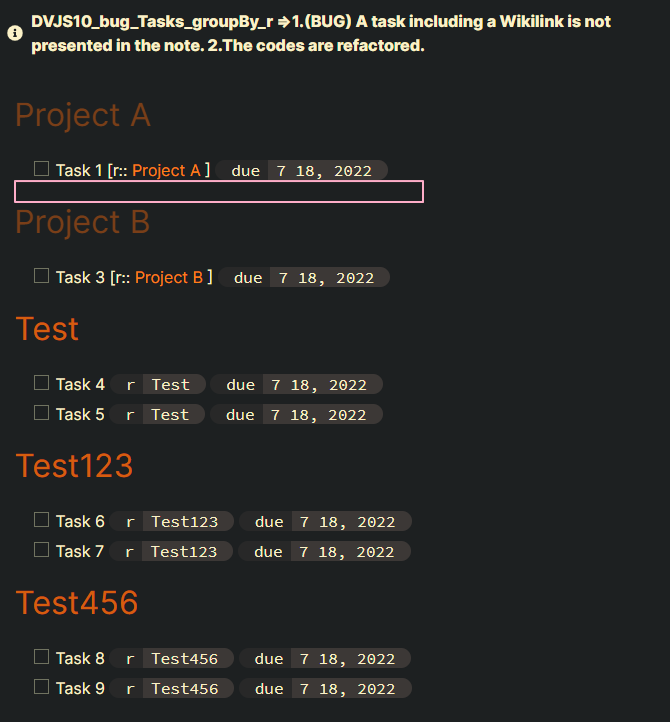
DVJS10_bug_Tasks_groupBy_r
Summary
Main DVJS
| Code Name | Data type | Purposes | Remark |
|---|---|---|---|
| DVJS10 _bug _Tasks _groupBy_r |
t.r:1.a string 2.a link |
1.(BUG) A task including a Wikilink is not presented in the note. 2.The codes are refactored. |
1.easier to read 2.easier to modify |
Summary_code
Code DVJS10_bug_Tasks_groupBy_r
title: DVJS10_bug_Tasks_groupBy_r =>1.(BUG) A task including a Wikilink is not presented in the note. 2.The codes are refactored.
collapse: close
icon:
color:
```dataviewjs
// M09. Define n:
// #####################################################################
// let n = dv.date("2022-07-18");
let n = luxon.DateTime.now();


// M11. Define filtered_tasks: gather all relevant tasks
// #####################################################################
let filtered_tasks = dv
    .pages(
        '"100_Project/01_dataviewjs/01_by_example/Q13_Tasks_groupBy/Q13_test_data"'
    )
    .file.tasks.filter(
        (t) =>
            t.due &&
            Math.floor(n.diff(t.due, "days").days) == 0 &&
            !t.completed
    );


// M13. GROUP BY task.r:
// #####################################################################
for (let related of filtered_tasks.groupBy((t) => t.r)) {
    dv.header(2, related.key);
    dv.taskList(
        filtered_tasks.filter((t) => t.r == related.key),
        false
    );
}

```
Screenshots(DVJS10)
let n = dv.date(“2022-07-18”);
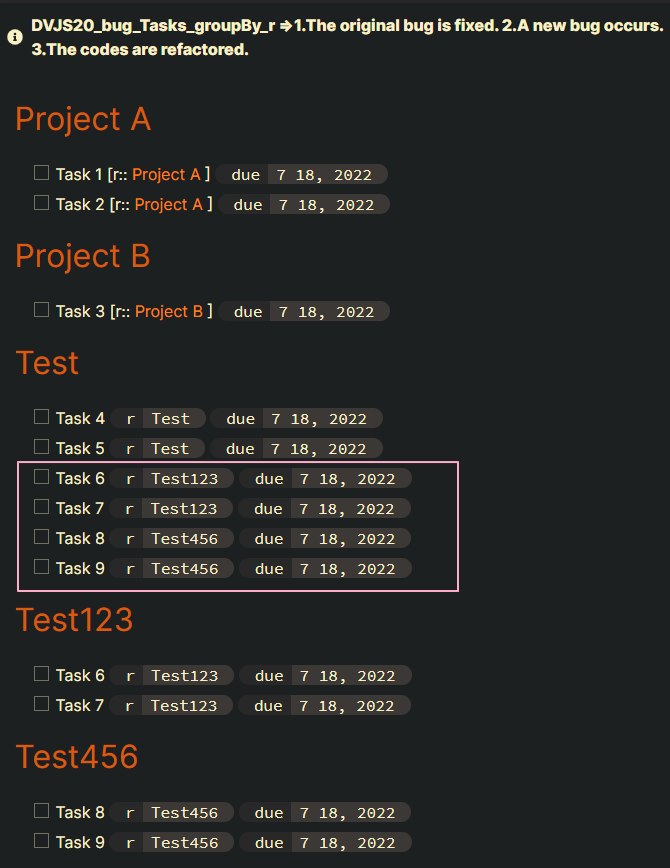
DVJS20_bug_Tasks_groupBy_r
Summary
Main DVJS
| Code Name | Data type | Purposes | Remark |
|---|---|---|---|
| DVJS20 _bug _Tasks _groupBy_r |
t.r:1.a string 2.a link |
1.The original bug is fixed. 2.A new bug occurs. 3.The codes are refactored. |
1.easier to read 2.easier to modify |
Summary_code
Code DVJS20_bug_Tasks_groupBy_r
title: DVJS20_bug_Tasks_groupBy_r =>1.The original bug is fixed. 2.A new bug occurs. 3.The codes are refactored.
collapse: close
icon:
color:
```dataviewjs
// M09. Define n:
// #####################################################################
// let n = dv.date("2022-07-18");
let n = luxon.DateTime.now();


// M11. Define filtered_tasks: gather all relevant tasks
// #####################################################################
let filtered_tasks = dv
    .pages(
        '"100_Project/01_dataviewjs/01_by_example/Q13_Tasks_groupBy/Q13_test_data"'
    )
    .file.tasks.filter(
        (t) =>
            t.due &&
            Math.floor(n.diff(t.due, "days").days) == 0 &&
            !t.completed
    );


// M13. GROUP BY task.r:
// #####################################################################
for (let related of filtered_tasks.groupBy((t) => t.r)) {
    dv.header(2, related.key);
    dv.taskList(
        // Edited by Justdoitcc 2022-07-18
        //filtered_tasks.filter((t) => t.r == related.key),
        filtered_tasks.filter((t) => dv.func.contains(t.r, related.key)),
        false
    );
}

```
Screenshots(DVJS20)
let n = dv.date(“2022-07-18”);
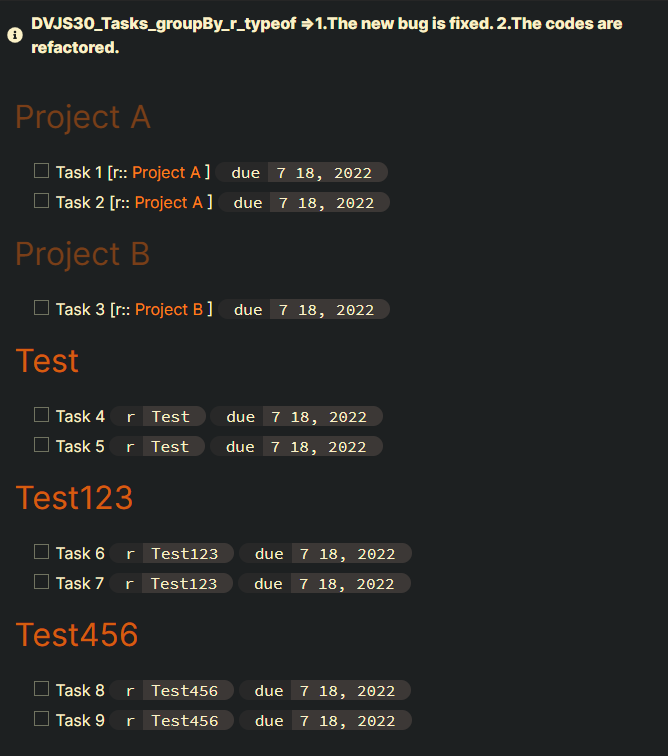
DVJS30_Tasks_groupBy_r_typeof
Summary
Main DVJS
| Code Name | Data type | Purposes | Remark |
|---|---|---|---|
| DVJS30 _Tasks _groupBy_r _typeof |
t.r:1.a string 2.a link |
1.The new bug is fixed. 2.The codes are refactored. |
1.easier to read 2.easier to modify |
Summary_code
Code DVJS30_Tasks_groupBy_r_typeof
title: DVJS30_Tasks_groupBy_r_typeof =>1.The new bug is fixed. 2.The codes are refactored.
collapse: close
icon:
color:
```dataviewjs
// M09. Define n:
// #####################################################################
// let n = dv.date("2022-07-18");
let n = luxon.DateTime.now();


// M11. Define filtered_tasks: gather all relevant tasks
// #####################################################################
let filtered_tasks = dv
    .pages(
        '"100_Project/01_dataviewjs/01_by_example/Q13_Tasks_groupBy/Q13_test_data"'
    )
    .file.tasks.filter(
        (t) =>
            t.due &&
            Math.floor(n.diff(t.due, "days").days) == 0 &&
            !t.completed
    );


// M13. GROUP BY task.r:
// #####################################################################
for (let related of filtered_tasks.groupBy((t) => t.r)) {
    dv.header(2, related.key);
    dv.taskList(
        // Edited by Justdoitcc 2022-07-18 21:05
        //filtered_tasks.filter((t) => t.r == related.key),

        // Edited by Justdoitcc 2022-07-18 21:30
        //filtered_tasks.filter((t) => dv.func.contains(t.r, related.key)),
        filtered_tasks.filter((t) =>
            dv.func.choice(
                dv.func.typeof(t.r) === "link",
                dv.func.contains(t.r, related.key),
                t.r === related.key
            )
        ),
        false
    );
}

```
Screenshots(DVJS30)
let n = dv.date(“2022-07-18”);
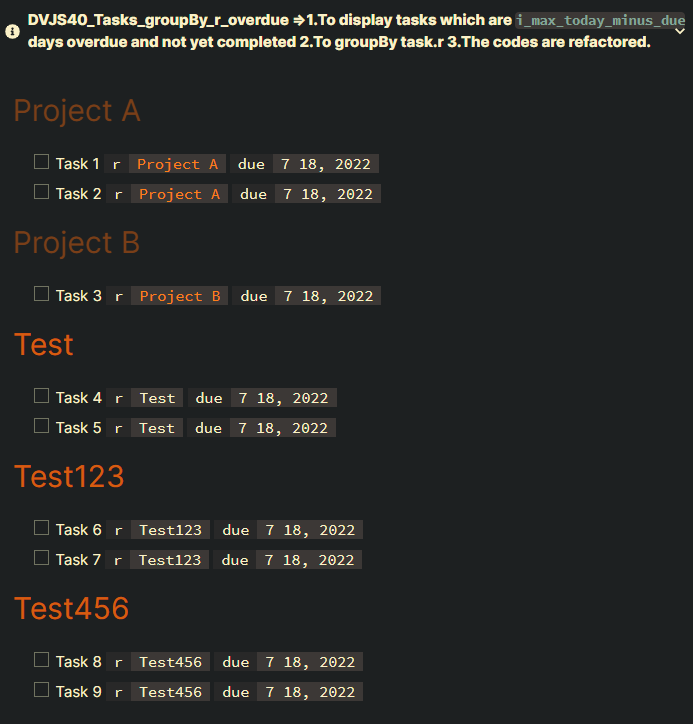
DVJS40_Tasks_groupBy_r_overdue
Summary
Main DVJS
| Code Name | Data type | Purposes | Remark |
|---|---|---|---|
| DVJS40 _Tasks _groupBy_r _overdue |
t.r:1.a string 2.a link |
1.To display tasks which are I_MAX_TODAY_MINUS_DUE days overdue and not yet completed2.To groupBy task.r 3.The codes are refactored. |
1.easier to read 2.easier to modify |
Summary_code
Code DVJS40_Tasks_groupBy_r_overdue
title: DVJS40_Tasks_groupBy_r_overdue =>1.To display tasks which are `I_MAX_TODAY_MINUS_DUE` days overdue and not yet completed 2.To groupBy task.r 3.The codes are refactored.
collapse: close
icon:
color:
```dataviewjs
// M09. Define TODAY:
// #####################################################################
// const TODAY = dv.date("2022-07-18");
const TODAY = dv.date("today");


// M10. Define I_MAX_TODAY_MINUS_DUE:
// #####################################################################
const I_MAX_TODAY_MINUS_DUE = 36500; // TODAY - t.due <= 36500 days


// M11. Define filtered_tasks: gather all relevant tasks
// #####################################################################
let filtered_tasks = dv
    .pages(
        '"100_Project/01_dataviewjs/01_by_example/Q13_Tasks_groupBy/Q13_test_data"'
    )
    .file.tasks
    .where(
        (t) =>
            t.due &&
            !t.completed &&
            TODAY - t.due >= dv.duration("0 days") &&
            // dv.date("today") - t.due <= dv.duration("36500 days")
            TODAY - t.due <= dv.duration(I_MAX_TODAY_MINUS_DUE + " days")

    );


// M13. GROUP BY task.r:
// #####################################################################
for (let related of filtered_tasks.groupBy((t) => t.r)) {
    dv.header(2, related.key);
    dv.taskList(
        filtered_tasks
            .where((t) =>
                dv.func.choice(
                    dv.func.typeof(t.r) === "link",
                    dv.func.contains(t.r, related.key),
                    t.r === related.key
                )
            )
            .sort(r, "asc"),
        false
    );
}


```
Screenshots(DVJS40)
const TODAY = dv.date(“2022-07-18”);
2 Likes
Here’s a slight addition: colorful bars.
dataviewjs source block:
```dataviewjs

// First, get all notes:
const notes = dv.pages();

// Now get three JS arrays of the three data categories from those notes:
const fitnessDataArray = notes.Fitness.array();
const writingDataArray = notes.Writing.array();
const nutritionDataArray = notes.Nutrition.array();

// Now let's create the sums of each of these data categories:
const fitnessSum = fitnessDataArray.reduce((partialSum, a) => partialSum + a, 0);
const writingSum = writingDataArray.reduce((partialSum, a) => partialSum + a, 0);
const nutritionSum = nutritionDataArray.reduce((partialSum, a) => partialSum + a, 0);

// ... and put those in an array for later visualization:
const dataArray = [fitnessSum, writingSum, nutritionSum];

// Now let's setup the data for the chart:
const chartData = {
   labels: ['Fitness', 'Writing', 'Nutrition'],
   datasets: [
      {
         label: 'Data from notes',
         data: dataArray,
         backgroundColor: [
            'rgba(192, 0, 128, 0.3)',
            'rgba(128, 192, 32, 0.3)',
            'rgba(32, 0, 192, 0.3)',
         ],
         borderColor: [
            'rgba(192, 0, 128, 1.0)',
            'rgba(128, 192, 32, 1.0)',
            'rgba(32, 0, 192, 1.0)',
         ],
         borderWidth: 2
      }
   ]
}

// Let's configure the chart:
const config = {
   type: 'bar',
   data: chartData
}

// Lastly, let's render the chart:
window.renderChart(config, this.container)
```
Hope this helps, @snowbiker100 …
6 Likes
@justdoitcc - works as expected.
Another follow-up question. I’ve observed that the headings created using dv.header() function don’t fold. Is it possible to make them?
Dataview_v0.5.39 can convert dataview results to properly formatted markdown.
Maybe it will do that sooner or later.
In addition, I add the final version: DVJS40_Tasks_groupBy_r_overdue.
1.let i_max_today_minus_due = 0;
=>
1.To display tasks which are 0 days overdue and not yet completed
2.To groupBy task.r
2.let i_max_today_minus_due = 10;
=>
1.To display tasks which are 10 days overdue and not yet completed
2.To groupBy task.r
2 Likes
Turn your dataview table into a static standard table (can be used to publish!).
The trick is to use a templater template for your dataviewjs code.
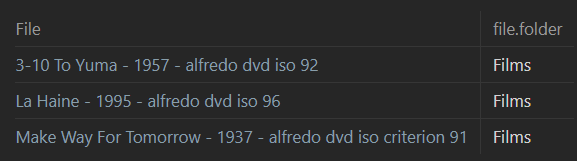
Here is an example of a simple table that gets its pages from ‘a Folder, tagA and not tagB’, where a dataview field contains “This Word”. (For context, it is used to get a list of films that I have but haven’t seen yet that are on my wishlist for the next Criterion Blu-ray sale).
Put this code in a templater template (no backticks, just begin with <% and end with %> and modify it to suit your purposes.
<%*
const headers = ["File", "file.folder"];
const tableValues = DataviewAPI.pages('"Films" and -#saw and #wishlist')
.where (p => p.edition.includes("Criterion"))
.sort(p => p.file.name, 'asc')
.map(p =>[p.file.link, p.file.folder]);
const myTable = DataviewAPI.markdownTable(headers, tableValues);
-%>
<% myTable %>
Now call the template into a file. Done.
Results:
Tip: I’m going to just keep re-using the same template name, thereby over-riding the code every time. So I’m going to keep the code wrapped in %% to hide it from preview mode just above the table it creates. That way I can re-use to ‘update’ the table.
Thanks to AnnaKornfeldSimpson who figured this out. She has written instructions with an example on Github’s Dataview Discussion here:
12 Likes
I didn’t see this already on the forums when I searched, so here’s an easy way to automatically populate an entry with data from Goodreads.
Add the ID of the book in your frontmatter:
---
goodreads: 57587638
---
Then add this script. Personally I put it in a separate .js file, and use dv.view() to insert it on the page.
```dataviewjs
const id = dv.current().goodreads
if (id) {
const raw = await requestUrl({ url: "https://www.goodreads.com/en/book/show/" + parseInt(id, 10) })
const html = raw.text
const coverImage = html.match(/div class="editionCover".*?img src="([^"]+)"/s)
if (coverImage) dv.paragraph(``)
let rating = html.match(/itemprop="ratingValue">([^<]+)/s); rating = rating ? ` (${rating[1].trim()} stars)` : ''
dv.paragraph(`[View on Goodreads](https://www.goodreads.com/en/book/show/${id})${rating}`)
}
```
And you’ll get a nice cover image and info pulled straight from Goodreads site:

Of course you can adjust this to pull out any of the info that you want - summary, genres, etc.
11 Likes
For the inline yaml data inside the file which includes the dataviesjs code,
now I’m usiing the top head tag like the following.
dv.pages("#tag_for_thisfile")
Is there any method to use something like ‘this.file.blahblah’?
Because I have many such files, it is very laborous to change every tag inside them.
As requested by @Ooker on Discord:
Here is a dataviewjs custom view that uses the plugin MetaEdit’s API to update an inline field in my note with the number of completed tasks in that note. I have auto-refresh on at an interval of about 30 seconds in my “Settings” → “Dataview” settings page, so within 30 seconds of checking off a task the count on the note will increase.
Note.md:
...
## Tasks
- [x] Task I finished, hurrah! Maybe there are more of these.
...
## Reflection
Tasks Done Today:: 1
...
```dataviewjs
await dv.view("scripts/dvjsViews/updateTodayFields", dv.current());
```
%% ABOVE THIS LINE IS THE DATAVIEWJS TO CALCULATE FIELDS %%
The comment is there because I use Live Preview, which hides the dataviewjs codeblock since it does not itself produce any output, and I do not want to accidentally overwrite it so I put in the big all-caps warning. ![]()
scripts/dvjsViews/updateTodayFields.js:
await updateTodayFields(input, dv);

async function updateTodayFields(input, dv) {
	if (!input) return;
	const { getPropertyValue, update } = app.plugins.plugins.metaedit.api;

	const howMany = input.file.tasks.filter(t => t.completed).length;

	const currentlyRecorded = await getPropertyValue("Tasks Done Today", input.file.path);
	if (howMany !== currentlyRecorded) {
		await update("Tasks Done Today", howMany, input.file.path);
	}
}
4 Likes
I have tried tweaking the code but keep failing on how to make it work with my current YAML format of “birthday: DD-MM-YYYY”.
Would greatly appreciate any help i can get.
@metawops Thank you so much! This is a great start. I am working with it and this is a great help to me. ![]()
1 Like
Hi DataviewJs Team,
I have a quick question:
When I use the “query” I get the paragraph that I put the #highlight tag on.
#highlight
But when I use “dataview” How can I get the paragraph that I put the #highlight tag on? Of course, all I get is the file name NOT the paragraph text I put the tag on. Thank you for any help you can provide:
table
from #highlight