obsidiantools
![]() Hi all, I’ve released a Python package called obsidiantools, available now through PyPI.
Hi all, I’ve released a Python package called obsidiantools, available now through PyPI.
obsidiantools is built upon common libraries in the Python data stack, like Pandas and NetworkX, to enable you to do advanced analytics of your vault and notes.
Check out the Github repo:
I am not a software engineer who does JavaScript or TypeScript - if someone wants to collab on integrating this package into an Obsidian plugin I’d be interested in exploring that!
 Getting started
In your Python environment, run pip install obsidiantools.
Check out the README for more detail on API usage. It’s incredibly simple.
 Demo
Demo
See the functionality through a virtual Binder environment here:
![]()
 Key features
This is how obsidiantools can complement your workflows for note-taking:
- Access a
networkxgraph of your vault (vault.graph) - Get summary stats about your notes, e.g. number of backlinks and wikilinks, in a Pandas dataframe
- Get the dataframe via
vault.get_note_metadata()
- Get the dataframe via
- Retrieve detail about your notes’ links as built-in Python types
- The various types of links:
- Wikilinks (incl. header links, links with alt text)
- Backlinks
- You can access all the links in one place, or you can load them for an individual note:
- e.g.
vault.backlinks_indexfor all backlinks in the vault - e.g.
vault.get_backlinks(<NOTE>)for the backlinks of an individual note
- e.g.
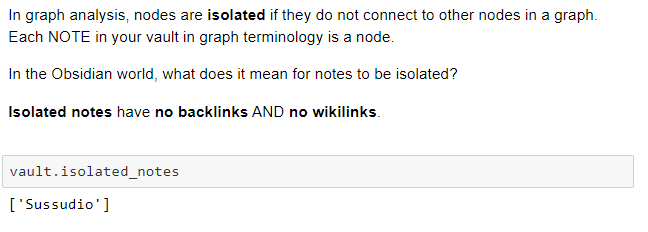
- Check which notes are isolated (
vault.isolated_notes) - Check which notes do not exist as files yet (
vault.nonexistent_notes)
- The various types of links:
Using obsidiantools in your note-taking workflow
Through obsidiantools you can recreate your vault’s graph via NetworkX and I’ve shown a basic graph in the demo. NetworkX graphs are no replacement for the Obsidian app’s graphing capabilities! For a start, the app is interactive and NetworkX has limited customisation options.
Where NetworkX graphs really complement workflows are through:
- Having a graph structured in Python’s most popular network analysis graph.
- Processing the graph into a summary Pandas dataframe.
- Being able to use the advanced capabilities of the library, e.g. doing deep dive analysis on subgraphs of your vault, applying algorithms to your vault (such as PageRank).
Especially in large vaults, these capabilities can enable you to narrow down which notes you want to focus on.
 Images
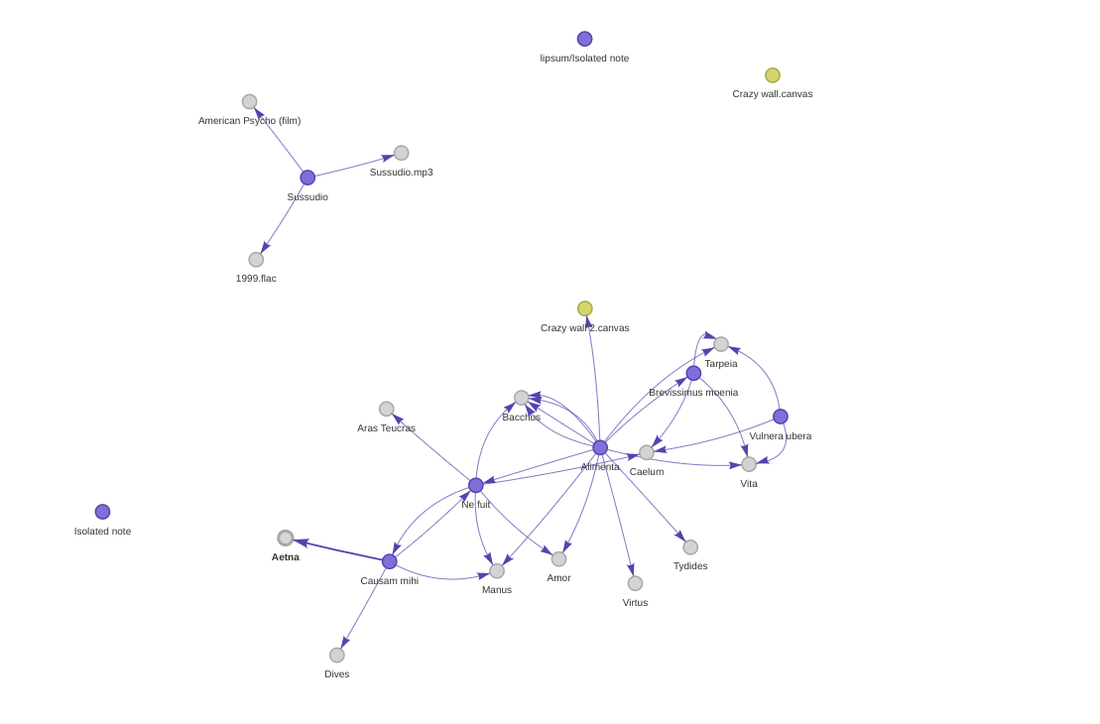
A basic chart I made with Matplotlib to mirror the Obsidian vault graph (‘nonexistent’ notes are greyed out):
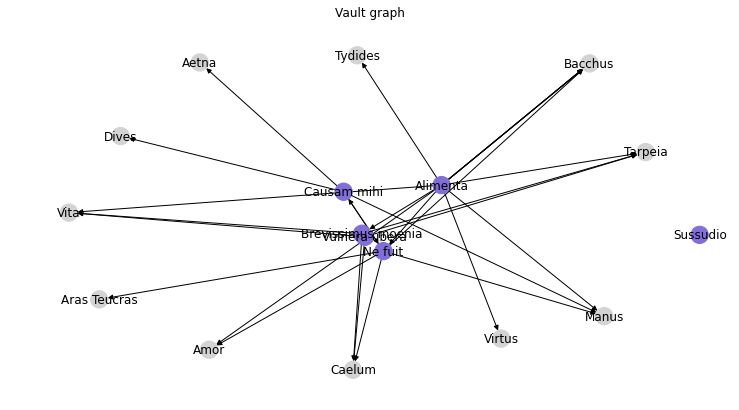
As you can see from the chart there’s one note that is isolated:
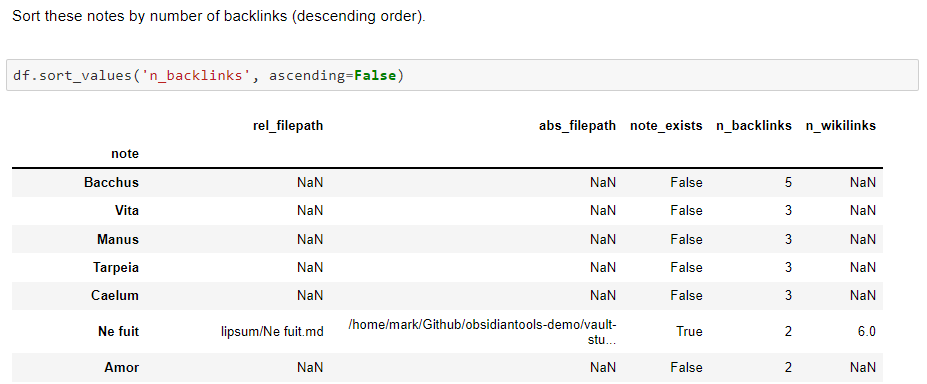
dataframe df sorted by number of backlinks:
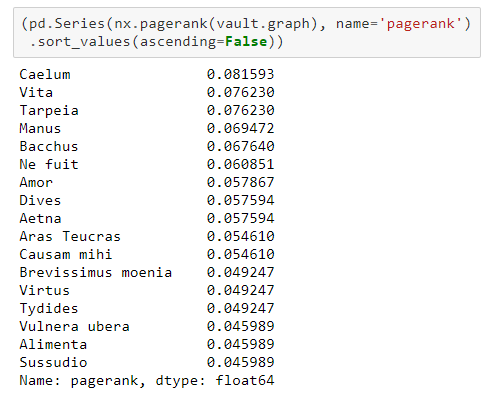
PageRank values of notes (via NetworkX graph):
 Future development
I will use the Github repo for the project development. I won’t have much time for the rest of the year for development but welcome ideas, pull requests etc.
I have tested the functionality on my own vaults of up to 100 notes but interested to see in how other people’s vaults fare with the package.
The key things I’d like to do in future are:
- More functionality for Zettelkasten vault formats.
- e.g. neat way to parse any timestamps from note filenames and integrate in the dataframe.
- More metadata columns in dataframe:
- e.g. created time, could be useful here. Not supported for Linux though (need to think about design, tests etc.).
- metadata on the text e.g. word counts.
- Bring the md file readers into the main API.
- I’m not sure how the parsing works for non-Latin text currently and whether more config is needed. If the parsing works well e.g. for Chinese then it would be great to bring it in.
- Bring markdown link counts into the API.
- Expand documentation for network analysis, e.g. code snippets on different centrality measures. Expand to include basic NLP analysis if supporting md files in the main API.


 Hi there, I have done a new release v0.6 with these extra features: