Steps to reproduce
Different mermaid diagrams display wildly different size and scaling behaviors as more information is added to them:
-
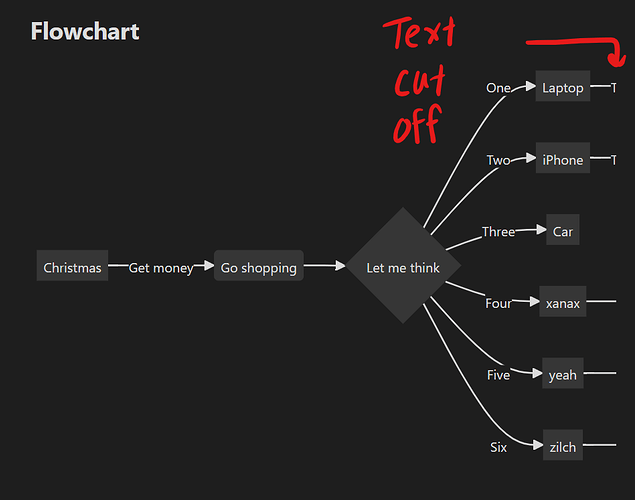
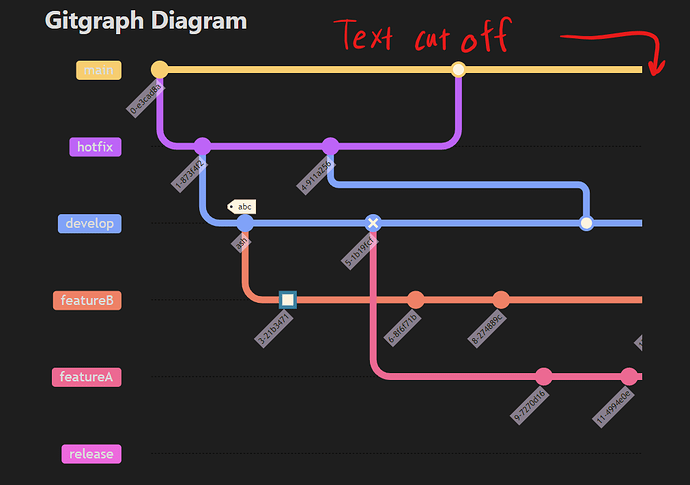
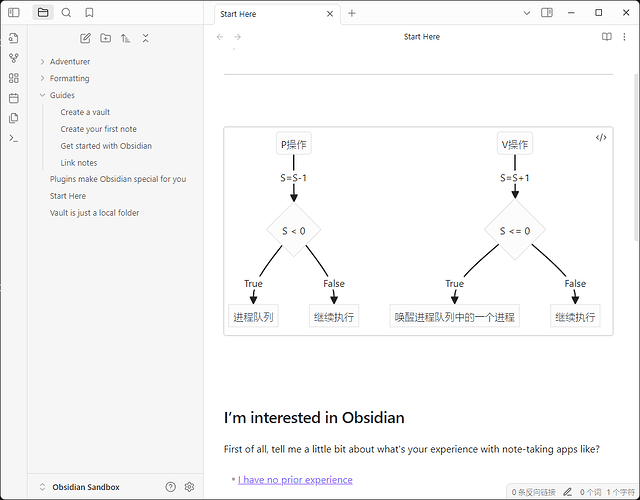
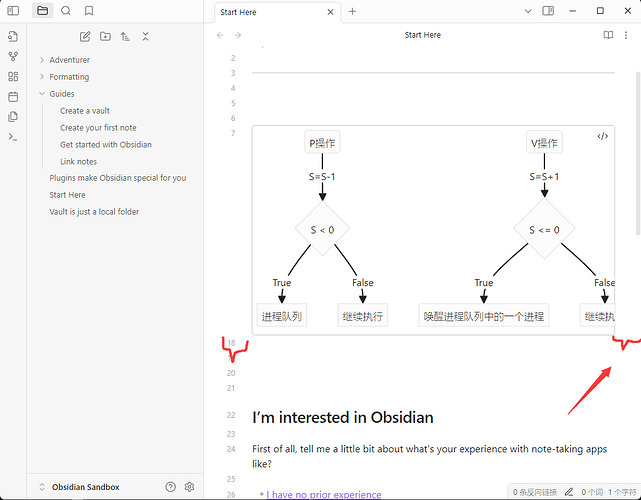
Flowchart and Gitgraph diagrams extend off the edge of the page
-
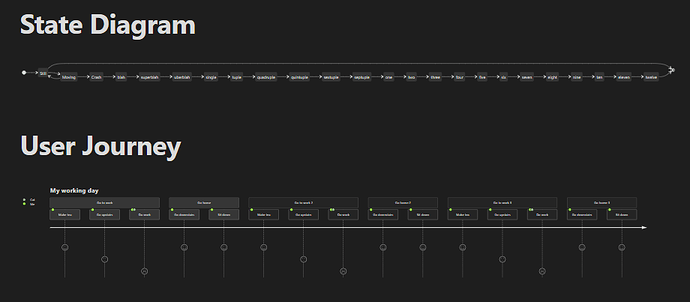
State Diagrams, User Journeys, and Timelines shrink as more info is added until they’re illegible
-
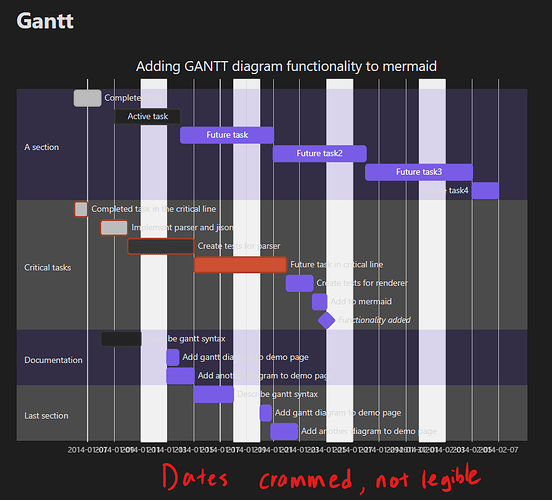
Gantt charts shove more info into themselves while not changing size, making denser charts hard to read
Here’s the code I used for all of them:
Code for diagrams
Flowchart
flowchart LR
    A[Christmas] -->|Get money| B(Go shopping)
    B --> C{Let me think}
    C -->|One| D[Laptop]
    C -->|Two| E[iPhone]
    C -->|Three| F[fa:fa-car Car]
    C -->|Four| X[xanax]
    C -->|Five| Y[yeah]
    C -->|Six| Z[zilch]
    D -->|Test| G[b]
    E -->|Test| H[bl]
    X --> I[bla]
    Y --> J[blah]
    Z --> K[blahb]
    G --> P[blahbl]
    H --> Q[blahbla]
    I --> R[blahblah]
    J --> S[blahblahb]
    K --> T[blahblahbl]
Gitgraph Diagram
%%{init: { 'logLevel': 'debug', 'theme': 'base' } }%%
      gitGraph
        commit
        branch hotfix
        checkout hotfix
        commit
        branch develop
        checkout develop
        commit id:"ash" tag:"abc"
        branch featureB
        checkout featureB
        commit type:HIGHLIGHT
        checkout main
        checkout hotfix
        commit type:NORMAL
        checkout develop
        commit type:REVERSE
        checkout featureB
        commit
        checkout main
        merge hotfix
        checkout featureB
        commit
        checkout develop
        branch featureA
        commit
        checkout develop
        merge hotfix
        checkout featureA
        commit
        checkout featureB
        commit
        checkout develop
        merge featureA
        branch release
        checkout release
        commit
        checkout main
        commit
        checkout release
        merge main
        checkout develop
        merge release
State Diagram
stateDiagram
	direction LR
    [*] --> Still
    Still --> [*]

    Still --> Moving
    Moving --> Still
    Moving --> Crash
    Crash --> blah
    blah --> superblah
    superblah --> uberblah
    uberblah --> single
    single --> tuple
    tuple --> quadruple
    quadruple --> quintuple
    quintuple --> sextuple
    sextuple --> septuple
    septuple --> one
    one --> two
    two --> three
    three --> four
    four --> five
    five --> six
    six --> seven
    seven --> eight
    eight --> nine
    nine --> ten
    ten --> eleven
    eleven --> twelve
    twelve --> [*]
User Journey
journey
    title My working day
    section Go to work
      Make tea: 5: Me
      Go upstairs: 3: Me
      Do work: 1: Me, Cat
    section Go home
      Go downstairs: 5: Me
      Sit down: 5: Me
	section Go to work 2
      Make tea: 5: Me
      Go upstairs: 3: Me
      Do work: 1: Me, Cat
    section Go home 2
      Go downstairs: 5: Me
      Sit down: 5: Me
	section Go to work 3
      Make tea: 5: Me
      Go upstairs: 3: Me
      Do work: 1: Me, Cat
    section Go home 3
      Go downstairs: 5: Me
      Sit down: 5: Me
Timeline
timeline
title Timeline of Industrial Revolution
section 17th-20th century
Industry 1.0 : Machinery, Water power, Steam <br>power
Industry 2.0 : Electricity, Internal combustion engine, Mass production
Industry 3.0 : Electronics, Computers, Automation
section 21st century
Industry 4.0 : Internet, Robotics, Internet of Things
Industry 5.0 : Artificial intelligence, Big data,3D printing
Gantt
gantt
    dateFormat  YYYY-MM-DD
    title       Adding GANTT diagram functionality to mermaid
    excludes    weekends
    %% (`excludes` accepts specific dates in YYYY-MM-DD format, days of the week ("sunday") or "weekends", but not the word "weekdays".)

    section A section
    Completed task            :done,    des1, 2014-01-06,2014-01-08
    Active task               :active,  des2, 2014-01-09, 3d
    Future task               :         des3, after des2, 5d
    Future task2              :         des4, after des3, 5d
    Future task3              :         des5, after des4, 6d
    Future task4              :         des6, after des5, 2d

    section Critical tasks
    Completed task in the critical line :crit, done, 2014-01-06,24h
    Implement parser and jison          :crit, done, after des1, 2d
    Create tests for parser             :crit, active, 3d
    Future task in critical line        :crit, 5d
    Create tests for renderer           :2d
    Add to mermaid                      :1d
    Functionality added                 :milestone, 2014-01-25, 0d

    section Documentation
    Describe gantt syntax               :active, a1, after des1, 3d
    Add gantt diagram to demo page      :after a1  , 20h
    Add another diagram to demo page    :doc1, after a1  , 48h

    section Last section
    Describe gantt syntax               :after doc1, 3d
    Add gantt diagram to demo page      :20h
    Add another diagram to demo page    :48h
Did you follow the troubleshooting guide? Yes.
Expected result
It would be best if all diagrams displayed in a consistent way that made them readable regardless of how much info is inside them.
I think the best way to do this would be to allow all diagrams to expand and extend off the edge instead of shrinking, and make them all horizontally scrollable with CSS code as shown below to access the cut-off sections. Doing so would make them readable regardless of their horizontal size.
.markdown-source-view .mermaid {
  overflow: scroll;
}
Environment
SYSTEM INFO:
Obsidian version: v1.4.13
Installer version: v1.4.13
Operating system: Windows 10 Home 10.0.22631
Login status: logged in
Catalyst license: supporter
Insider build toggle: on
Live preview: on
Legacy editor: off
Base theme: dark
Community theme: none
Snippets enabled: 0
Restricted mode: off
Plugins installed: 7
Plugins enabled: 0
RECOMMENDATIONS:
none
