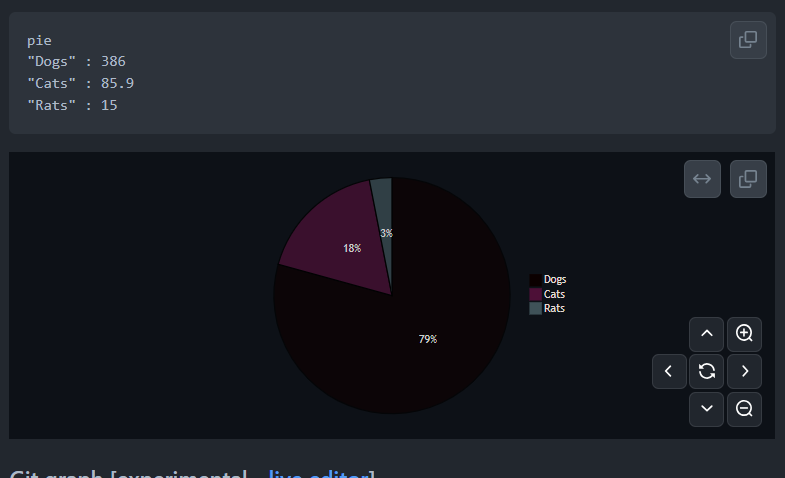
This assumes all mermaid diagrams are rendered to fill the available horizontal space of the page (line width) and the user zooms and pans via buttons.
This would be amazing and would solve all my problems with Mermaid!
I think it would also be good to add a button expanding the diagram into something like a full-screen popup allowing the user to pan and zoom using their mouse and scroll wheel. The buttons and popup on Github are a little annoying to use, especially for long timelines, as the buttons don’t have enough granularity and the viewer is too thin to easily use.
This is mainly for really large graphs that end up getting cropped. The graph gets restricted to 100% width normally, then expands to either its original width or whatever max-width is on hover. This gets combined with obsidian stylist to set the scale class:
`classname:scale250`
```mermaid
classDiagram
...
It’s a bit chunky but it makes sure that I can at least get both a full-picture view as well as a zoomed view when necessary.
If found a workaround (in Obsidian 1.5.3 at least) by using ![[mermaid graph note]] embedded in another note, and you can scroll left and right to see the complete graph.
Okay, maybe not, because moving around with a clicking button just feels weird.
Can’t we zoom in and out and pan with the mouse? Would that be better? Like Excalidraw.
Here is what I currently use as a temporary fix for “too wide” & “too small text” mermaid flowchart.
First of all, thank you for developing and maintaining Obsidian. It’s an incredibly powerful tool that I rely on daily for my knowledge management. The Mermaid integration, in particular, is fantastic for visualizing complex information.
However, I’d like to provide some feedback regarding the UI for viewing Mermaid graphs, specifically when dealing with larger or more complex diagrams.
Current Issues / Pain Points:
Currently, viewing complex Mermaid graphs can be challenging due to the following limitations:
Lack of Zoom Functionality: There’s no built-in way to zoom in for details or zoom out for an overview of the entire graph. This makes it difficult to grasp the full picture of large diagrams.
Limited Panning: While scrollbars appear for graphs larger than the view, there’s no intuitive way to pan the view (e.g., by dragging with the mouse). Navigating large graphs requires fiddling with scrollbars.
Fixed/Limited Viewport: The area where the graph is rendered seems to be confined to a fixed region, regardless of the window or pane size. It almost feels like the graph is forced onto a specific paper size within the digital space. This prevents users from utilizing larger screen real estate effectively and necessitates frequent scrolling, especially with complex graphs, hindering efficient viewing.
Suggested Improvements:
To address these issues, I propose the following enhancements:
Implement Zoom: Add seamless zoom functionality, ideally using mouse wheel (e.g., Ctrl/Cmd + Scroll) or pinch gestures on touchpads.
Implement Pan: Allow users to easily pan the graph view by dragging with the mouse (e.g., middle-click drag, right-click drag, or holding a specific key while dragging).
Flexible Viewport:
Allow the graph rendering area to dynamically resize based on the available window or pane size.
Alternatively, provide an option or button to maximize the graph view to utilize the available space better.
Expected Benefits:
These improvements would significantly enhance the usability of the Mermaid integration:
Greatly improve the readability and navigation of complex Mermaid graphs.
Make interacting with graphs more intuitive and enhance the overall user experience.
Lead to a smoother workflow when analyzing or understanding visualized information.
I believe these enhancements would make Obsidian an even better tool for visual thinking and knowledge exploration. Thank you for considering this feedback.
I’m looking forward to the continued development of Obsidian!
Yes, I would love to be able to zoom and pan in mermaid graphs, especially ones like timeline that just keep adding horizontally and getting tinier and tinier.
A slight modification to the code provided by @PRO-2684.
I wanted a delay before zooming in on hover (to avoid the diagram jumping to full size the moment my mouse crosses its border), and to make zoom out almost instantaneous: