Summary_code
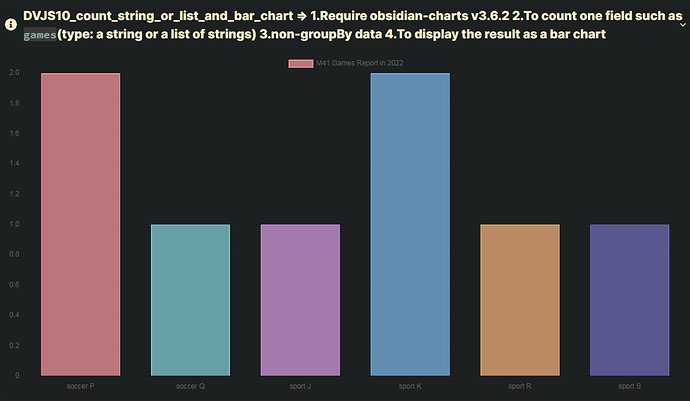
title: DVJS10_count_string_or_list_and_bar_chart => 1.Require obsidian-charts v3.6.2 2.To count one field such as `games`(type: a string or a list of strings) 3.non-groupBy data 4.To display the result as a bar chart
collapse: open
icon:
color:
```dataviewjs
// M11. define pages: gather all relevant pages
// #####################################################################
let pages = dv
    .pages('"100_Project/01_dataviewjs/01_by_example/Q82_BarChart/Q82_test_data"')
    .where((page) => page.games)
    .sort((page) => page.file.name, "asc");


// M21. define s_label_of_chart for the chart: excel chart title
// ### Used by obsidian-charts v3.6.2 ###
// #######################################################
let s_label_of_chart = "M41.Games Report in 2022";


// M23. define a_labels_of_chart for the chart: excel Category X-axis
// ### Used by obsidian-charts v3.6.2 ###
// use .array() to transform a dataview array into a JavaScript array
// dv_array.array() = dv_array.values = dv_array["values"]
// #######################################################
// ["N", "File", "count_games", "games"],
let a_labels_of_chart = pages.games.array();


// 23.10 Define h_count_of:{soccer P: 2}
// #####################################################################
// {
//   "soccer P": 2,
//   "soccer Q": 1,
//   "sport J": 1,
//   "sport K": 2,
//   "sport R": 1,
//   "sport S": 1
// }

let h_count_of = {};
for (let name of a_labels_of_chart) {
    if (name in h_count_of) {
        h_count_of[name]++;
    } else {
        h_count_of[name] = 1;
    }
}


// 23.20 update a_labels_of_chart: To get unique key and sort it
// #####################################################################
a_labels_of_chart = Object.keys(h_count_of).sort();


// #######################################################
// #######################################################
// M23.DEB10 Debug Output: a_labels_of_chart
// from: DVJS40_sum_number_or_list_and_bar_chart
// #######################################################
// #######################################################

// M23.DEB12 Debug Output: a_labels_of_chart: before using `.array()`
// #######################################################
// {
//   "values": [
//     "2022-02-02",
//     "2022-02-07",
//     "2022-03-02",
//     "2022-03-07"
//   ],
//   "length": 4
// }


// M23.DEB14 Debug Output: a_labels_of_chart: after using `.array()`
// #######################################################
// The following is the content of the a_labels_of_chart.
// [
//   "2022-02-02",
//   "2022-02-07",
//   "2022-03-02",
//   "2022-03-07"
// ]


// M25.define a_data_of_chart for the chart: excel data series
// ### Used by obsidian-charts v3.6.2 ###
// use .array() to transform a dataview array into a JS array
// dv_array.array() = dv_array.values = dv_array["values"]
// #######################################################
// let a_data_of_chart = pages.map((page) => dv.func.sum(page.exercise)).array();
//// Suppose that each of game name is unique
//// let p = Array(3).fill(1); //=> [1,1,1]
//// let a_data_of_chart = Array(pages.games.length).fill(1);

// [2, 1, 1, 2, 1, 1];
let a_data_of_chart = a_labels_of_chart.map((e) => h_count_of[e]);


// #######################################################
// #######################################################
// M25.DEB10 Debug Output: a_data_of_chart
// from: DVJS40_sum_number_or_list_and_bar_chart
// #######################################################
// #######################################################

// M25.DEB13 Debug Output: a_data_of_chart: before using `.array()`
// #######################################################
// {
//     "values": [
//       60,
//       120,
//       95,
//       78
//     ],
//     },
//     "length": 4
//   }


// M25.DEB15 Debug Output: a_data_of_chart: after using `.array()`
// #######################################################
// [
//     60,
//     120,
//     95,
//     78
// ]


// M41.setup the data for the chart: No modification required
// Use PicPick:Color Picker to get rgb: [Color Picker](https://picpick.app/en/)
// #######################################################
const chartData = {
    labels: a_labels_of_chart,
    datasets: [
        {
            label: s_label_of_chart,
            data: a_data_of_chart,
            backgroundColor: [
                "rgba(230, 142, 147, 0.786)", //01:orange
                "rgba(123, 194, 200, 0.786)", //02:pink greenish
                "rgba(202, 145, 212, 0.786)", //03:pink purple
                "rgba(116, 171, 219, 0.786)", //04:pink blue
                "rgba(229, 168, 116, 0.786)", //05:pink orange
                "rgba(104, 103, 172, 0.786)", //06:pink purple 02
                "rgba(81, 196, 211, 0.786)",  //07:pink greenish 02

            ],
            borderColor: [
                "rgba(230, 142, 147, 1.0)", //01:orange
                "rgba(123, 194, 200, 1.0)", //02:pink greenish
                "rgba(202, 145, 212, 1.0)", //03:pink purple
                "rgba(116, 171, 219, 1.0)", //04:pink blue
                "rgba(229, 168, 116, 1.0)", //05:pink orange
                "rgba(104, 103, 172, 1.0)", //06:pink purple 02
                "rgba(81, 196, 211, 1.0)",  //07:pink greenish 02

            ],
            borderWidth: 2,
        },
    ],
};

// M43. configure the chart: No modification required
// #######################################################
const config = {
    type: "bar",
    data: chartData,
};

// M45. render the chart: No modification required
// #######################################################
window.renderChart(config, this.container);


// M91.TABLE : pages
// #####################################################################
// dv.header(2, "M91.Games Report in 2022");
// dv.table(
//     ["N", "File", "count_games", "games"],
//     pages.map((page, index) => [
//         index + 1,
//         page.file.link ,
//         dv.array(page.games).length,
//         page.games,
//     ])
// );


```
