When I created a fresh vault from an existing folder (a quite small one, 470 files, mostly non-Markdown files), CPU load is as low as when using the Sandbox vault.
Which makes me wonder if all of my local vaults have some issue with their config or caches?
How can I troubleshoot this further?
What I’m trying to do
Nothing in particular. I only want to use my vaults without maxing out the fans.
I’m not seeing this on my Mac. I would expect the things you tried would clear up or reveal the source of the problem. Just to add to the list of basics: did you try rebooting the computer?
Are you using any kind of sync (Obsidian Sync, iCloud, Dropbox, etc.)?
Thanks for the suggestion. Although rebooting is mainly a problem solver for Windows rather than Mac/Unix, I tried this today, but Obsidian went to ~80% CPU load again.
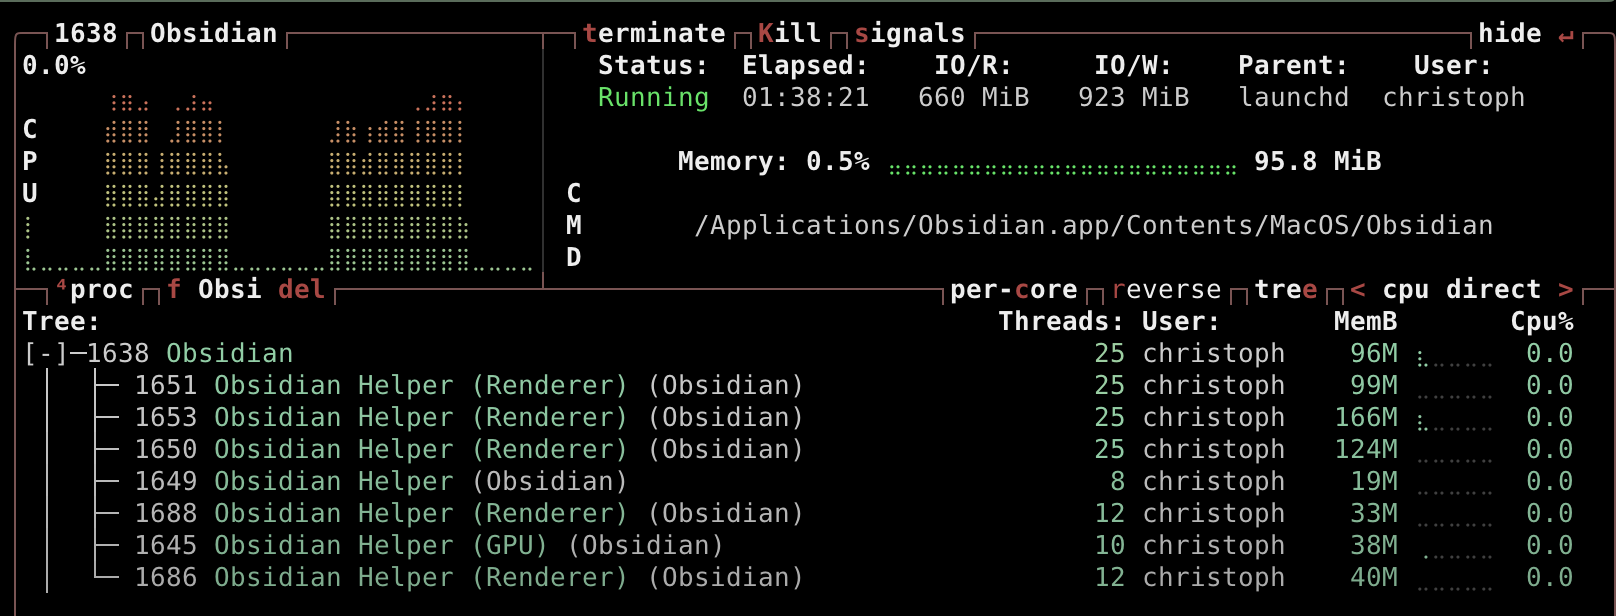
I let btop track the per-app CPU usage. For two hours, usage was between 50-90%.
After that, the CPU usage turned into an on-off pattern (a few seconds of activity followed by a few seconds of idling). After 4 hours of uptime, the pattern still persists.
Make a copy of your vault folder and open it as a vault in Obsidian. Does it have the same problem?
(After backing up) Try deleting or renaming config files 1 by 1 and restarting the app (I think Obsidian will regenerate ones that are missing, but you may want to research that). Does the behavior persist?
(After backing up, of course) Try removing other files 1 by 1, in case Obsidian is for some reason hung up on indexing one of them. As a first rough cut, you might remove all non-Markdown files, and if that has no effect put them back and try removing all Markdown files. If 1 of those does something and you have folders, you could get more granular by removing folders 1 by 1.
Testing config files one by one might make sense but on the other hand, I observe the problem with several of my vaults. They are completely separate. They don’t share files and are not nested inside each other.
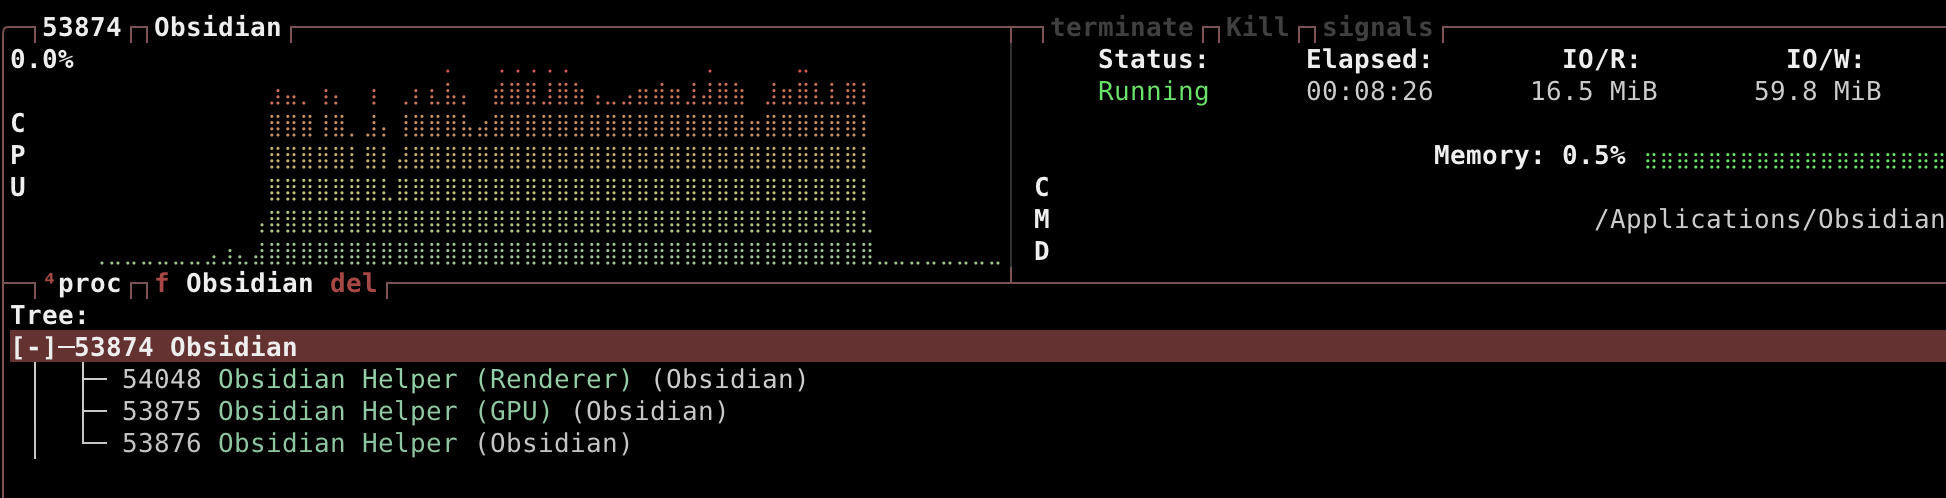
Just now, I opened some random folder as a new vault. So this is a brand-new vault with standard settings. No community plugins enabled (safe mode=on), not too many files inside (1,361 to be precise, with only 2 Markdown files).
After opening the vault, CPU usage of Obsidian.app stays around 80% for a couple of minutes, then drops to near-zero.
This pattern repeats every time I close and re-open the vault.
I am more and more convinced that Obsidian does some initial indexing whenever a vault is opened. The larger the vault, the longer it takes. (One of my vaults has 60,000 files inside, of which 2003 are Markdown files.)
Edited to add: I do not refer to the one-time initial indexing that Obsidian does with brand-new vaults. It must be something else that happens at every start of a vault.
Yeah, I’d expect it updates the index whenever you open a vault (because you could have changed the files while it was closed). I normally leave mine open all the time. I closed and reopened it and saw CPU go pretty high, settle at around 40%, then go back down, all taking about half a minute (this is on an M1 MacBook Air).
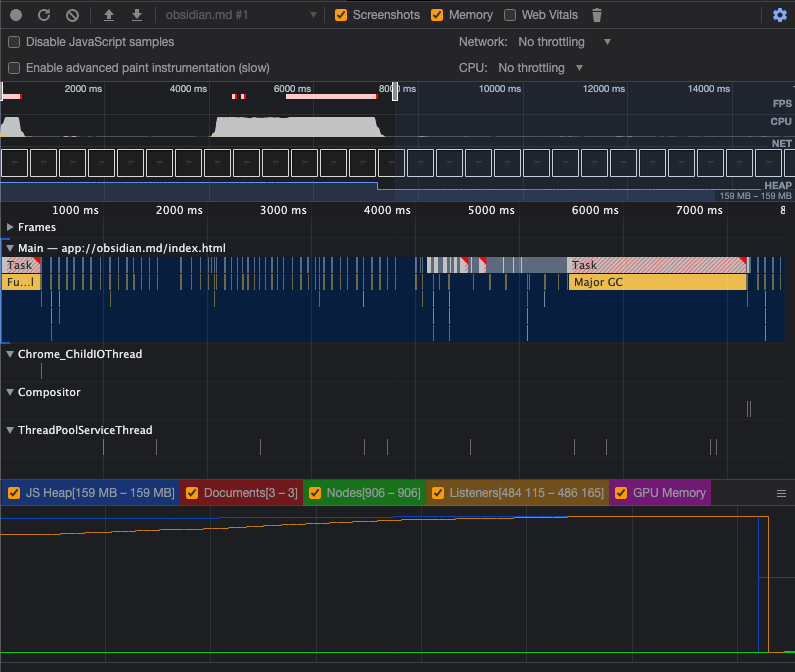
Maybe there is something here to explore?
That does look excessive (to not-an-Obsidian-developer me). And the I/O on the earlier pics you posted goes up to almost 1 GB.
Oh yeah, I forgot to mention that my vault has 6,000 files (mostly Markdown).
I would hope that your computer should be able to handle Obsidian without much trouble (I was thinking you might have an old Air; anyway I realized that I won’t have much insight into normal performance problems).
I’ll try putting my vault on my old Linux machine to see what happens, but I don’t know when I’ll get around to it.
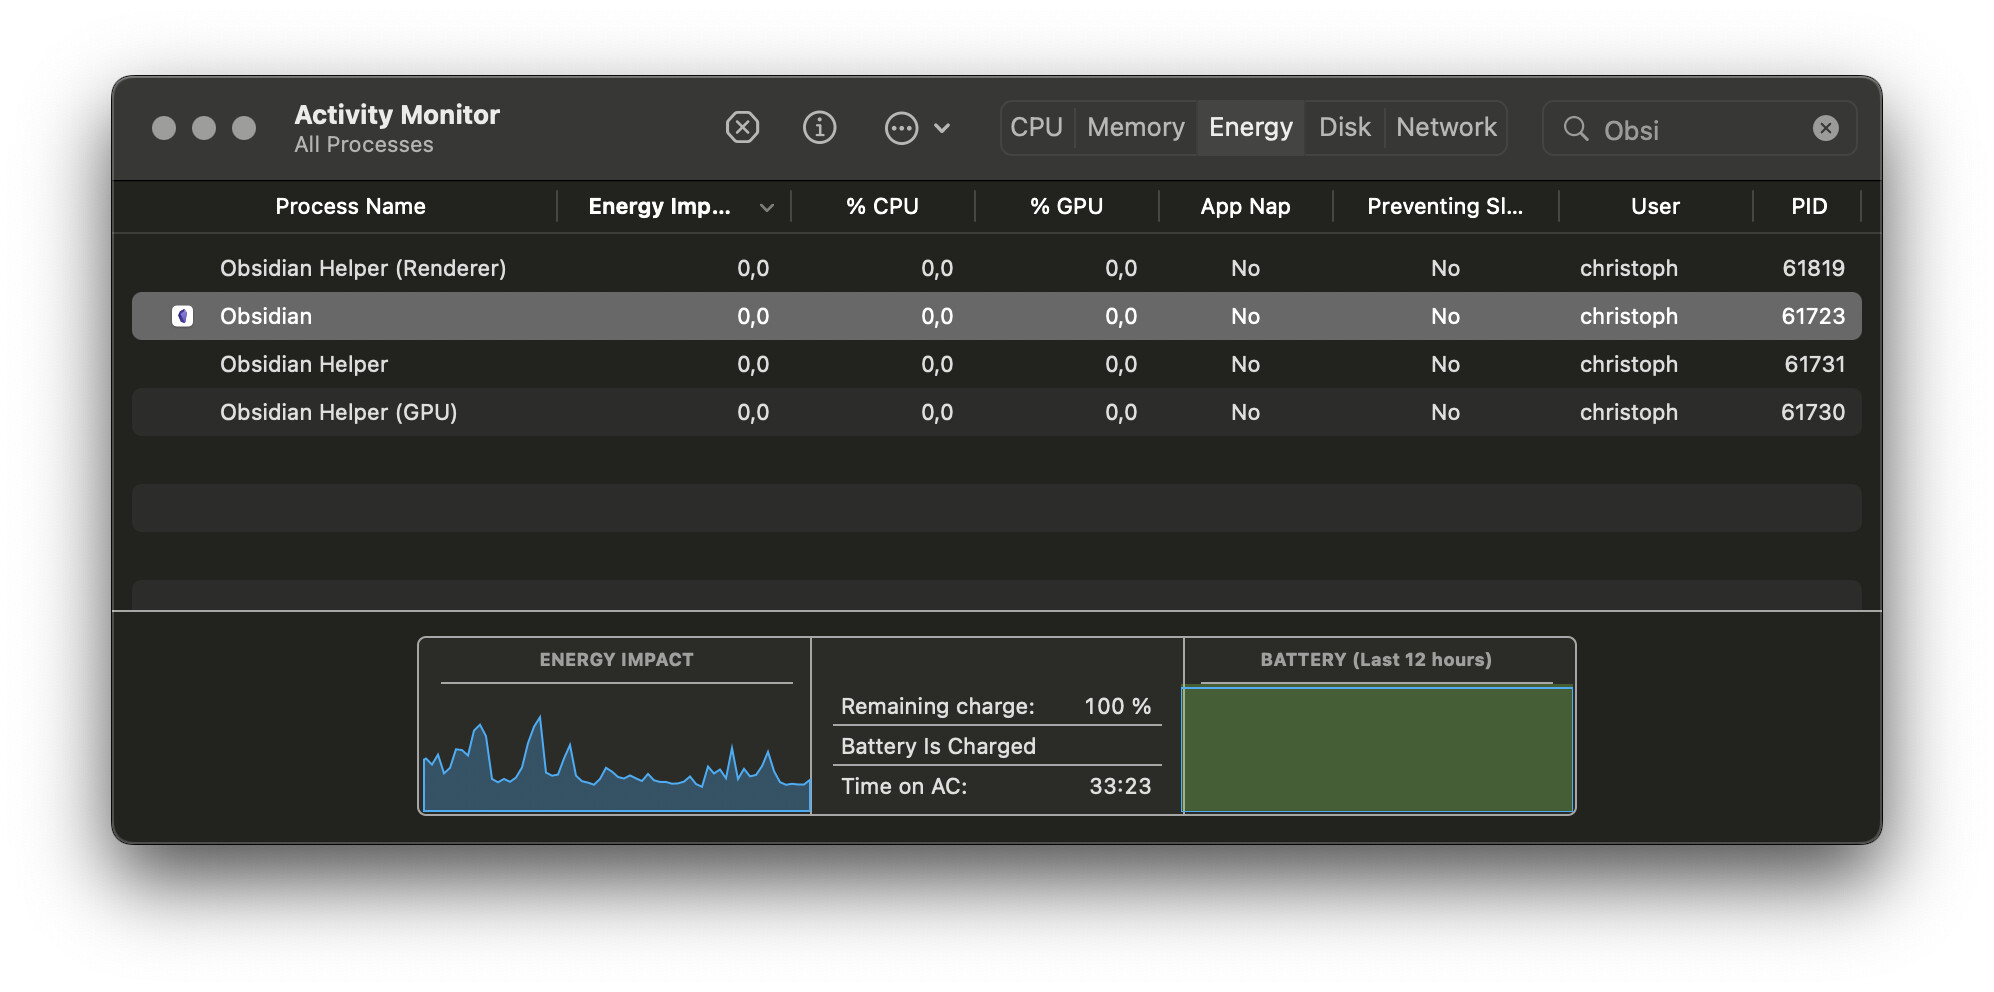
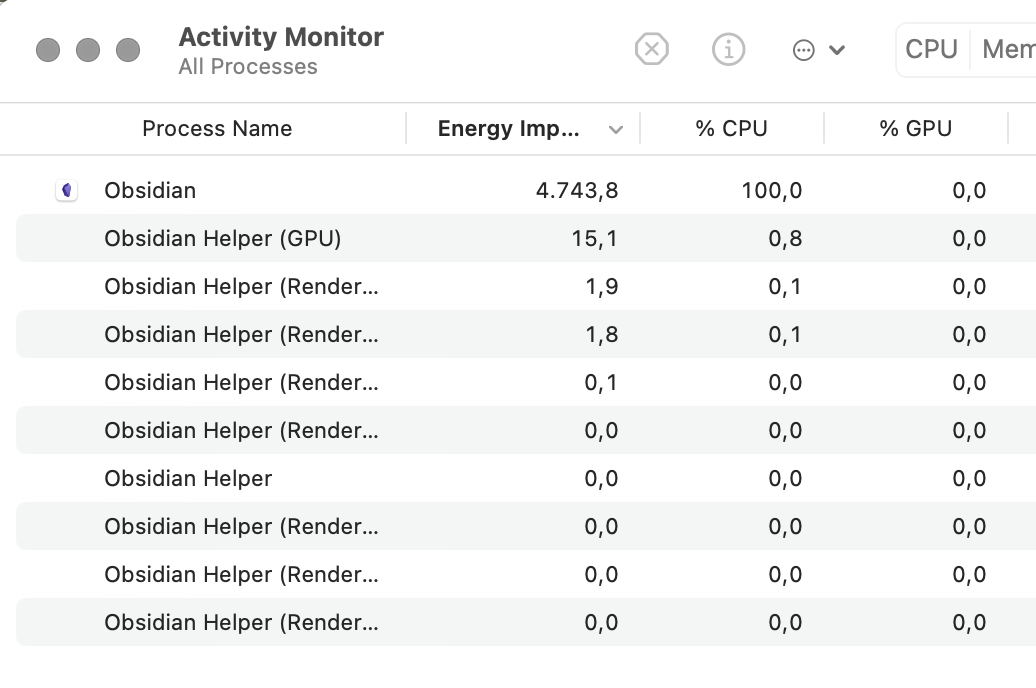
I have a new MacBook Pro 2023 now, with 12 CPU cores. Obsidian still consumes 100% CPU and when I am on battery, the time until empty reduces from 7-8 hours on normal load to 3 hours when Obsidian runs.
@CawlinTeffid Not yet, because meanwhile, I observed the following:
I had Obsidian open with one of the affected vaults, let’s name it Vault A.
After a while (I cannot tell how long it took—I noticed it one or two days later), CPU load dropped to near-zero.
I got curious and started another of the affected vaults (Vault B).
CPU went up to near-100%.
Then I stopped Vault B.
CPU load REMAINED at ~100%
I then dug further and found that Obsidian seems intensely busy with updating a database in
~/Library/Application Support/obsidian/IndexedDB/
One day later, the above scenario repeated. (I had one vault open, CPU load was at 100% but the next day it was near zero. I closed that vault and opened another one, and CPU load is at 100% again.)
I reckon that there is some horribly inefficient indexing going on that needs hours or a day to complete. And this repeats for every vault I open.
Am I right?
Is this a known issue?
If it is, are there already plans or ideas for fixing this?
I vaguely recall seeing one or more threads in which Obsidian got hung up on a particular file. I don’t remember if this was in the context of indexing — might have been sync or something else — but maybe that gives you something else to look into.