DataviewJS Snippet Showcase

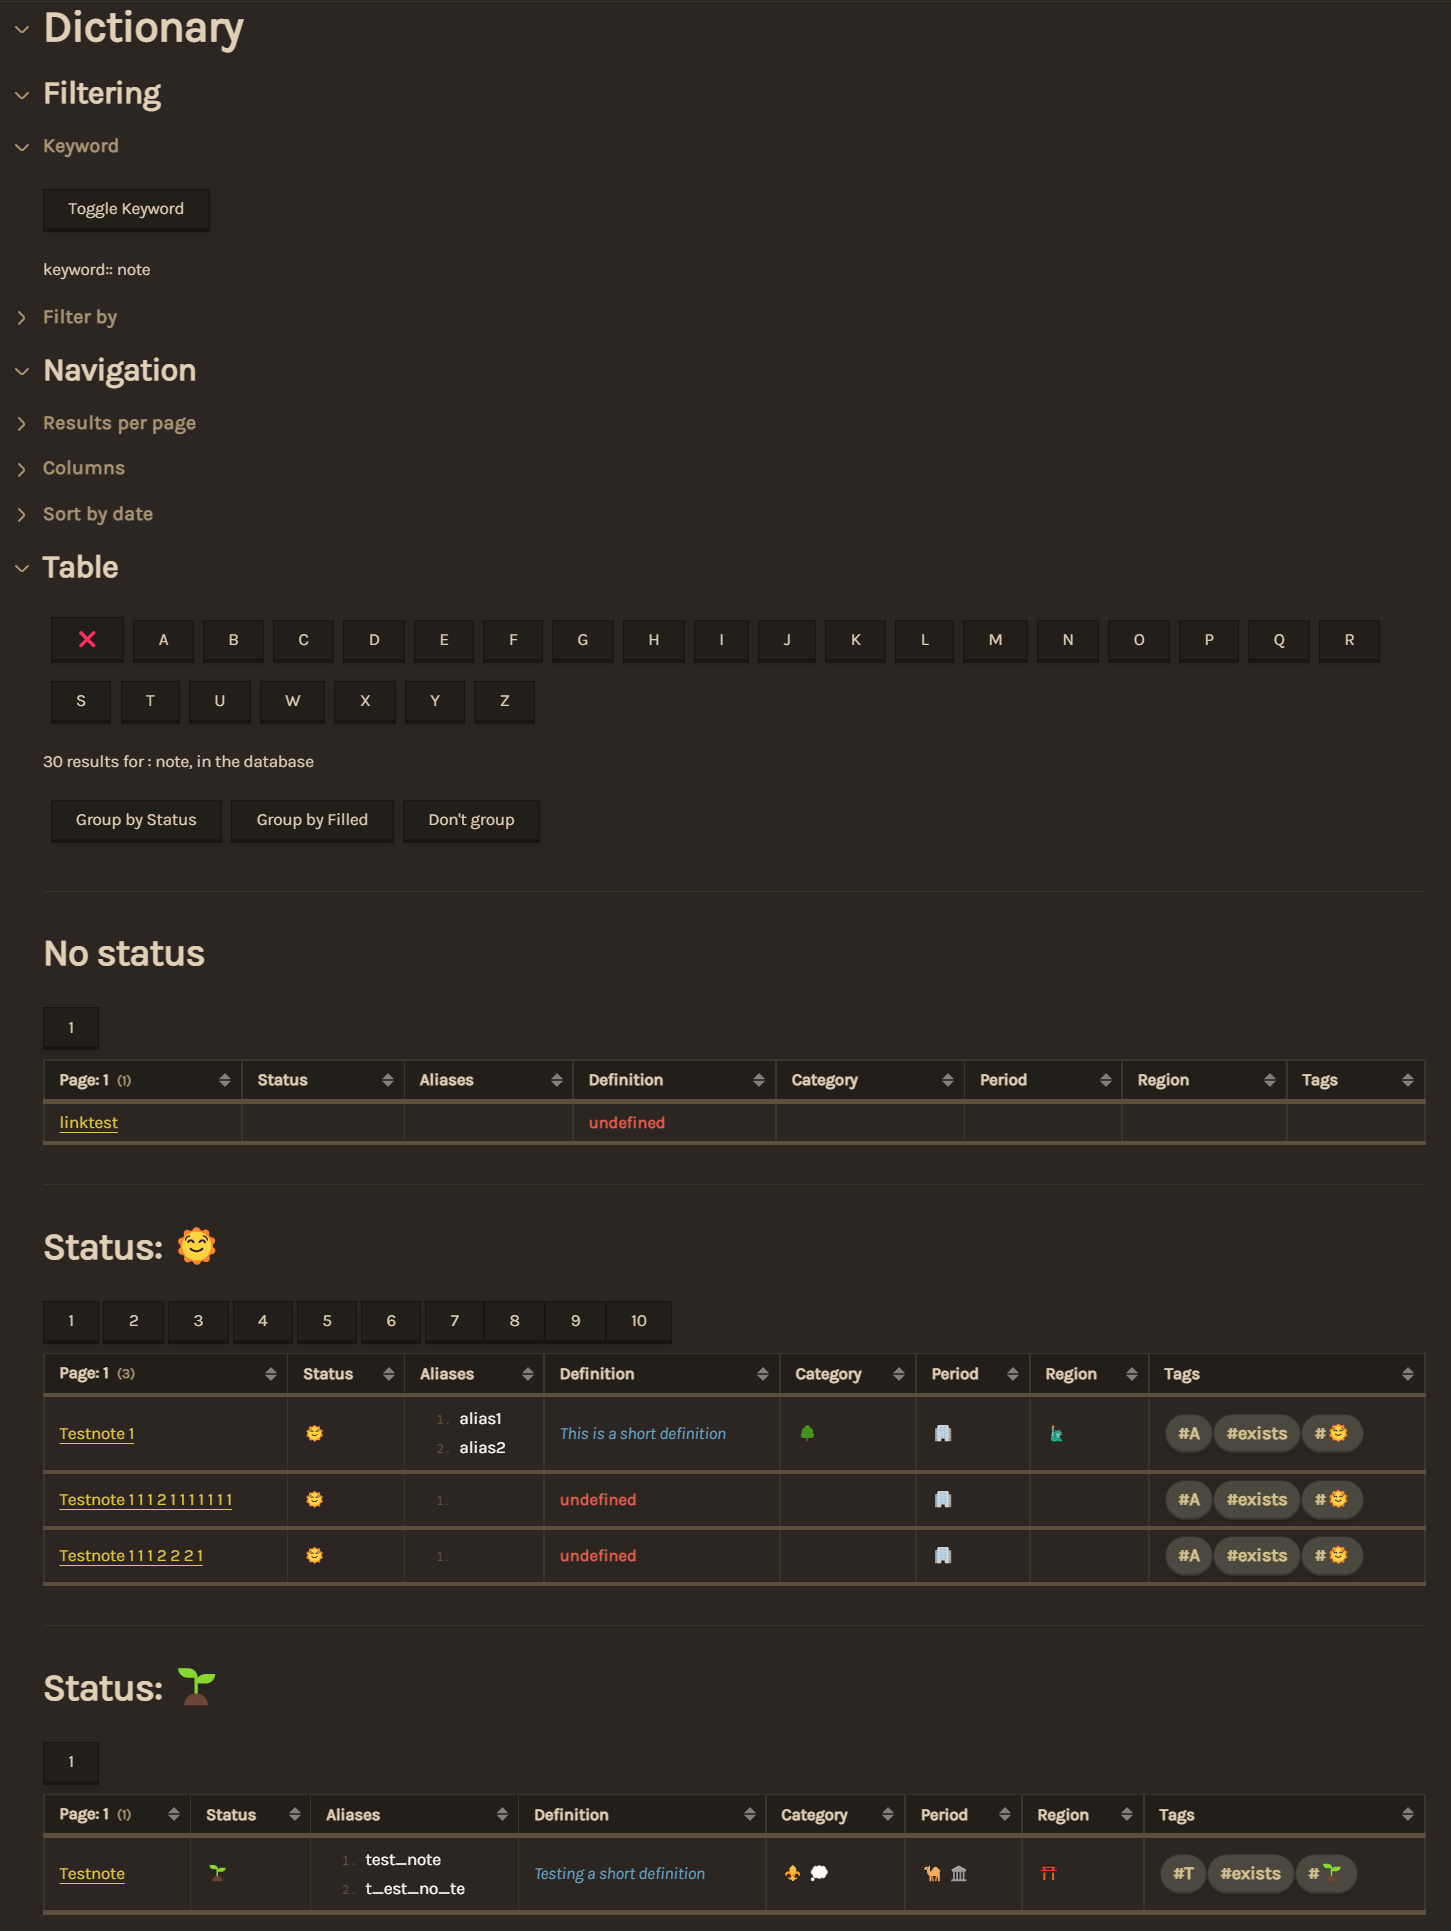
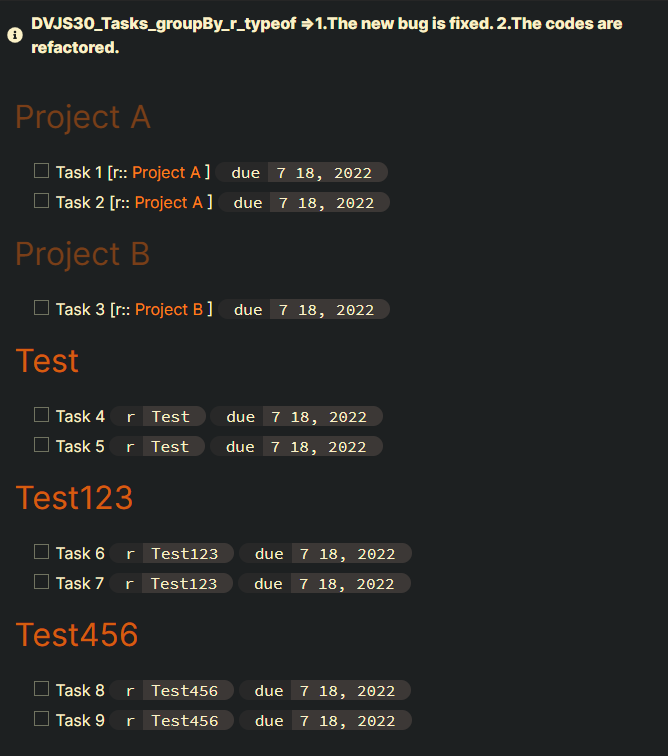
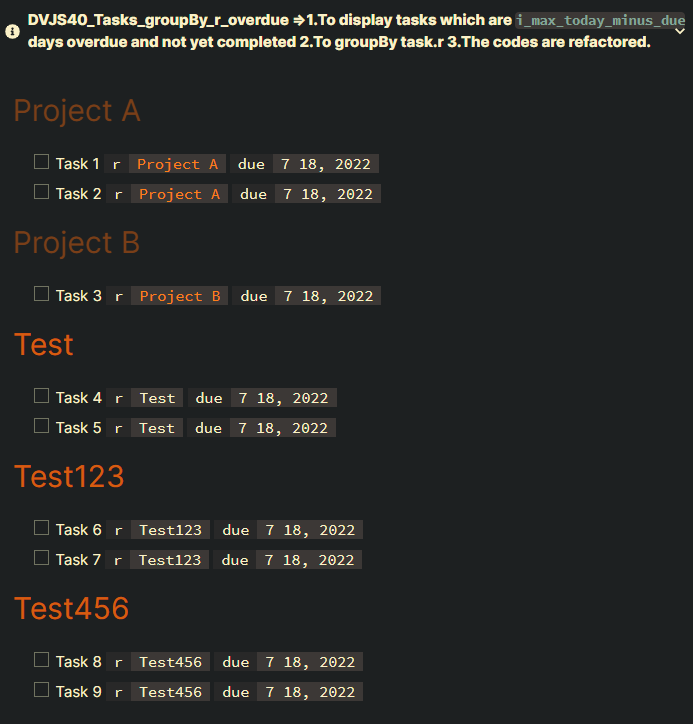
I’m in the process of creating a dictionary of architecture terms and having a blast using dataview(js) for the first time. It makes heavy use of the buttons plugin that pushes data into the YAML as properties.
It automatically generates pages, filters using keywords and properties and can group by different properties. The columns can be enabled and disabled and are all formatted according to their data. One thing I still want to add is a button column that inserts a template into the item, but I will have to figure out how to do that. I’m using some custom css snippets as well to format some stuff a bit neater with subtle animations. The code could definitely be cleaner/ better optimized but its pretty fast up to 500 items per page. Let me know if anyone has questions or tips on optimizing

const self = dv.current();
const definitions = [];
const input_string = self.keyword?.toLowerCase();
const string_array = input_string?.split(` `);
const filter_array = [self.status_filter, self.period_filter, self.category_filter, self.region_filter];
const input_letter = self.letter?.toLowerCase();
const result_amount = self.result_amount;

const pagebuttons = ["`button-page1` ", "`button-page2` ", "`button-page3` ", "`button-page4` ", "`button-page5` ", "`button-page6` ", "`button-page7`", "`button-page8`", "`button-page9`", "`button-page10`", "`button-page11`", "`button-page12`", "`button-page13`", "`button-page14`", "`button-page15`", "`button-page16`", "`button-page17`", "`button-page18`", "`button-page19`", "`button-page20`", "`button-page21`", "`button-page22`", "`button-page23`", "`button-page24`", "`button-page25`"];

function arrayContains(str, filter){
	return (str?.split(" ").some(r => filter?.includes(r)) || !filter);
}

const columns = ["Page: " + self.page.toString() + "  "];

const visible_columns = {
	Status: self.show_status,
	Aliases: self.show_aliases,
	Definition: self.show_short_definition,
	Category: self.show_category,
	Period: self.show_timeperiod,
	Region: self.show_region,
	Tags: self.show_tags,
	Created: self.show_created,
	Edited: self.show_edited
};

for (const key in visible_columns){
	visible_columns[key] && columns.push(key);
}

function splitString(string){
	return (string?.toString().split(","));
}
function formatTags(array,value){
	const formattedtags = splitString(value);
	array.push(formattedtags?.map(a => "#" + a).join(""));
}
function formatAliases(array,value){
	const formattedaliases = splitString(value);
	array.push(formattedaliases?.map(a => formattedaliases.indexOf(a) + 1 + ". " + a));
}
function formatShortDefinition(array,value){
	const formattedshortdefinition = (value ? "_" + value + "_" : "__undefined__");
	array.push(formattedshortdefinition);
}
function formatCategory(array,value){
	array.push(value);
}
function formatTimePeriod(array,value){
	array.push(value);
}
function formatRegion(array,value){
	array.push(value);
}
function formatCreated(array,value){
	array.push(value);
}
function formatEdited(array,value){
	array.push(value);
}

//list all pages from the chosen folder
const pages = dv.pages(self.test_mode == "1" ? ('"TestDefinitions"') : ('"Definitions"')).where(p =>
	(
		//either the title, description or any of the in-/ outlinks contains
		(p.file.name.toLowerCase()?.contains(input_string) && self.use_keyword) || p.file.aliases?.toString().contains(input_string) || 
         p.file.outlinks?.toString().toLowerCase().contains(input_string) || p.file.short_definition?.toLowerCase().contains(input_string) || 
         p.file.inlinks?.toString().toLowerCase().contains(input_string) || !self.use_keyword) &&

		//contains any of the chosen filters																							
		arrayContains(p.period,self.period_filter) &&	
		arrayContains(p.category,self.category_filter) &&																					  
		arrayContains(p.region,self.region_filter) &&	
		(p.status?.contains(self.status_filter) || !self.status_filter) &&

		//first letter starts with chosen letter filter																						
		(p.file.name[0]?.toLowerCase() == input_letter || !input_letter)
	);

//creates a text showing the search criteria
const filter_text = ((pages.length == 0 ? "No resullts for: " : (pages.length + " results for : ")) +
	((self.use_keyword) ? self.keyword + ", " : "") + filter_array.filter(Boolean).join(", ") + " in " + (self.letter != null ? ("'" + self.letter + "'") : "the database"));
dv.paragraph(filter_text);

//calculate page count for table
const page_count = parseInt(Math.ceil(pages.length / result_amount));

//grouping buttons
dv.span("`button-groupbystatus` `button-groupbyfilled` `button-dontgroup`");

//create a table for every group
for (const group of pages.groupBy(p => ((self.groupby == 1) ? p.status : ((self.groupby == 2) ? p.tags != null : p.False)))) {

	dv.paragraph("___");

	//group headers
	(self.groupby == 1) ? (dv.header(2, (group.key != null ? "Status: "+group.key : "No status"))) : ((self.groupby == 2) && (dv.header(2, (group.key != 1 ? "Unfilled" : "Filled"))));

	//generate page numbers
	for (let i = 0; i < group.rows.length; i++) {
		(i%result_amount==0)&&dv.span(pagebuttons[i/result_amount]);
	}

	//generate table
	dv.table(columns,
		group.rows
		.sort((c => (self.sortbytime%2>0) ? c.file.ctime.toString() : c.file.mtime.toString()),self.sortbytime<=2?'desc':`asc`)
		.map(p => {
			const columnsid = [p.file?.link];
			
			self.show_status && columnsid.push(p.status);
			self.show_aliases && formatAliases(columnsid,p.aliases);
			self.show_short_definition && formatShortDefinition(columnsid,p.short_definition);
			self.show_category && formatCategory(columnsid,p.category);
			self.show_timeperiod && formatTimePeriod(columnsid,p.period);
			self.show_region && formatRegion(columnsid,p.region);
			self.show_tags && formatTags(columnsid,p.tags);
			self.show_created && formatCreated(columnsid,p.file.ctime);
			self.show_edited && formatEdited(columnsid,p.file.mtime);
			
			return columnsid;
		})
		
		//show results per page
		.slice(result_amount * (self.page) - result_amount, result_amount * (self.page))
	);
}

13 Likes

I have some data with the following formats.

Side_A:: 2
Side_a:: 33
Side_B::444
Side_b:: 5555

Side_A:: 1
Side_a::22
Side_B::333
Side_b:: 4444

Side_A:: 5
Side_a::11
Side_B::222
Side_b:: 3333

let transpose = m => m[0].map((x,i) => m.map(x => x[i]));
let p = dv.pages('""')
let result = transpose([p.Side_A, p.Side_a, p.Side_B, p.Side_b])
// result = result.filter(x=>x[0] && x[1].contains(""))

dv.table(["A", "a", "B", "b"], result)

With this code, I succeeded in getting the data table.

A a B b
2 33 444 5555
1 22 333 4444
5 11 222 3333

Now, I’d like to get this table sorted according to A or B.
It would be very thankful if someone can give me a tip.

4 Likes

Add this before the dv.table line to sort by A:

result.values.sort((a, b) => a[0] - b[0])

Add this to sort by B:

result.values.sort((a, b) => a[2] - b[2])

4 Likes

@scholarInTraining thank you so much for your direction. I have been “playing” with the dataview, dataviewjs, and chart plugin. However, I do not see any examples of this idea of a simple chart. I am also hoping (as you) that other folks can provide a simple example. The “Dataview Simple Chart” is a missing link.

1 Like

They work perfectly for my purpose.

Thank you very much.


1 Like

Hi @snowbiker100 check out the screenshot in this thread from @metawops - below the code that is giving metawops an issue looks like a chart example. Maybe @metawops can help with your chart questions!

I’m sure we can work things out here, @snowbiker100. :blush:

As @scholarInTraining pointed out I have a rather simple chart inside of one of my notes that shows me the development of the downloads of my “Table to CSV exporter” plugin.
Because the data I want to visualize her resides in a JSON file of some sort/syntax I have to use a dataviewjs block rather than a dataview block because I have to read in the data from the JSON file it’s in and extract the x-axis (called labels in chart.js – on which the plugin “Obsidian Charts” is based) and y-axis data.

Here’s a screenshot of the dataviewjs source left and the result with the “Obsidian Charts” plugin on the right.

If I change the chart type to bar I get a bar chart of the same data like this:

Your data has to be simply inside of a JavaScript array if you use a dataviewjs block.

btw, the “Obsidian Charts” documentation is rather sparse and I find myself often on chartjs.org to learn more about all the options & possibilities. :wink: Browsing the samples there helps me, too.

If you have multiple data sets you’d have to add a 2nd, 3rd, … set to the datasets array – in my case that’s inside the const data structure. Each dataset is a dictionary and should at least contain a label (x-axis) and data (y-axis) key with arrays as values, respectively.

Does this help a bit? Don’t be shy to ask more questions! We’ll get there eventually! :wink:

4 Likes

@scholarInTraining Thank you so much for your continued help. I really appreciate it. These charts are exactly the type I could love to create. However, I want to load data from the markdown files in my vault. It looks like @metawops is loading data from a local JSON file. Especially I want to “Select Sum(Calorie) as CalorieTotal from all my MD Files Group by date.” Then have the types of charts @metawops had developed. That would be so wonderful. If you have any other ideas please let me know. Thank you, so much @scholarInTraining

3 Likes

@metawops any idea how to do what @snowbiker100 asked here?

Hi @snowbiker100,

can you be a bit more precise on what exactly you want to visualize here?
Are those bars representing a data category like „Fitness“, „Writing“ and „Nutrition“ and the height of the bars is the sum of those individual values?

Or … do you want the time on the x-axis and see the the values of those categories over time, for each day, for example?

And how are these data category values embedded inside your notes? Can you provide an example? The double colon notation suggests you‘re using Dataview‘s inline type of data encoding, right? So, not in a note‘s front matter YAML block?

1 Like

Sorry, should have included the link to the earlier post in this thread with some of those answers.

Yes, I saw that but it nevertheless leads me to those questions.

But I’ll assume something and see what I can come up with … :wink:

2 Likes

Well, here’s a start I was able to come up with quickly for @snowbiker100.
I know it’s not exactly what you want but at least it shows you to read out the data values of all notes in one particular folder. I know that you want to have different coloured bars but let’s that postpone to later for now. Is this going in the right direction, @snowbiker100?

Here’s a screenshot:

Note that because the sum of the Nutrition values is much higher than the sums of the Fitness and Writing data the bars are so different in height … :thinking:

2 Likes

Hi Everyone,

Hoping someone here can help me with something I’m trying to achieve.

To give a little bit of context, I capture all my tasks in my daily note and have metadata for each task - 1. “r” - related and 2. due. and I’m trying to create a task list for all things due today and group them by the ‘related’ project/kind of task.

Task capture in Daily notes as such
[ ] Task 1 [r:: [[Project A]] ] [due:: 2022-07-17]
[ ] Task 2 [r:: [[Project A]] ] [due:: 2022-07-17]
[ ] Task 3 [r:: [[Project B]] ] [due:: 2022-07-17]
[ ] Task 4 [r:: Test] [due:: 2022-07-17]
[ ] Task 5 [r:: Test] [due:: 2022-07-17]
Desired result in Task List
## [[Project A]]
[ ] Task 1 [r:: [[Project A]] ] [due:: 2022-07-17]
[ ] Task 2 [r:: [[Project A]] ] [due:: 2022-07-17]

## [[Project B]]
[ ] Task 3 [r:: [[Project B]] ] [due:: 2022-07-17]

## Test
[ ] Task 4 [r:: Test] [due:: 2022-07-17]
[ ] Task 5 [r:: Test] [due:: 2022-07-17]

With a lot of trial and error, I’ve come to this point where, I can find all tasks due today, and create H2 headings for each ‘related’ project/kind of task but for tasks with a r:: link to a file, I only get one task not all tasks.

My code snippet

var n = luxon.DateTime.now()
for (let related of dv.pages(-'"/Journal/Daily"').file.tasks.filter(t => t.due && Math.floor(n.diff(t.due,'days').days) == 0 &&!t.completed).groupBy(t => t.r))
{
  dv.header(2,related.key);
  dv.taskList(dv.pages(-'"/Journal/Daily"').file.tasks.filter(t => t.due && Math.floor(n.diff(t.due,'days').days) == 0 && t.r == related.key && !t.completed),false)
}
Achieved result in Task List with missing Task2
## [[Project A]]
[ ] Task 1 [r:: [[Project A]] ] [due:: 2022-07-17]

## [[Project B]]
[ ] Task 3 [r:: [[Project B]] ] [due:: 2022-07-17]

## Test
[ ] Task 4 [r:: Test] [due:: 2022-07-17]
[ ] Task 5 [r:: Test] [due:: 2022-07-17]

Instead of doing a second query to generate the content for your taskList inside the loop, can you just use related.rows? The first example on the DVJS Codeblock Examples page seems potentially useful.

1 Like

Topic

Summary
  • How to find the bug from the DVJS10_bug_Tasks_groupBy_r?
  • How to group the data by r which is a link like [[Project A]] or a string like “Test”?

Test

Summary
  • dataview: v0.5.46

Input

Summary

dictionary files

  • Location: “100_Project/01_dataviewjs/01_by_example/Q13_Tasks_groupBy/Q13_test_data”

folder: 02

  • filename : dic_20220206
---
Date: 2022-02-06
---
# Daily notes
- [ ] Task 1 [r:: [[Project A]] ] [due:: 2022-07-18]
- [ ] Task 2 [r:: [[Project A]] ] [due:: 2022-07-18]
- [ ] Task 3 [r:: [[Project B]] ] [due:: 2022-07-18]
- [ ] Task 4 [r:: Test] [due:: 2022-07-18]
- [ ] Task 5 [r:: Test] [due:: 2022-07-18]
- [ ] Task 6 [r:: Test123] [due:: 2022-07-18]
- [ ] Task 7 [r:: Test123] [due:: 2022-07-18]
- [ ] Task 8 [r:: Test456] [due:: 2022-07-18]
- [ ] Task 9 [r:: Test456] [due:: 2022-07-18]

DQL10_use_fTasks_and_get_uncompleted_and_overdue_tasks_and_groupBy_r

Summary

Main DQL

Code Name Data type Group By Purposes Remark
DQL10
_use_fTasks
_and_get
_uncompleted_and_overdue_tasks
_and_groupBy_r
flattened file.tasks yes 1.To filter by due
2.To filter by uncompleted task
3.To define a field variable TODAY_MINUS_DUE by using FLATTEN
4.To filter by TODAY_MINUS_DUE
5.To display the result as a TaskList
1.The DQL10 is the same as the DVJS40 in the topic.

Code DQL10_use_fTasks_and_get_uncompleted_and_overdue_tasks_and_groupBy_r

Summary_code
title: DQL10_use_fTasks_and_get_uncompleted_and_overdue_tasks_and_groupBy_r =>1.To filter by `due` 2.To filter by uncompleted task 3.To define a field variable `TODAY_MINUS_DUE` by using FLATTEN 4.To filter by `TODAY_MINUS_DUE` 5.To display the result as a TaskList
collapse: close
icon: 
color: 
```dataview
Task
FROM "100_Project/01_dataviewjs/01_by_example/Q13_Tasks_groupBy/Q13_test_data"

WHERE due
WHERE !completed

FLATTEN date("today") - due AS TODAY_MINUS_DUE
WHERE TODAY_MINUS_DUE <= dur("36500 days") AND TODAY_MINUS_DUE >= dur("0 days")

GROUP BY r
```

Screenshots(DQL10)


DVJS10_bug_Tasks_groupBy_r

Summary

Main DVJS

Code Name Data type Purposes Remark
DVJS10
_bug
_Tasks
_groupBy_r
t.r:
1.a string
2.a link
1.(BUG) A task including a Wikilink is not presented in the note.
2.The codes are refactored.
1.easier to read
2.easier to modify
Summary_code

Code DVJS10_bug_Tasks_groupBy_r

title: DVJS10_bug_Tasks_groupBy_r =>1.(BUG) A task including a Wikilink is not presented in the note. 2.The codes are refactored.
collapse: close
icon: 
color: 
```dataviewjs
// M09. Define n:
// #####################################################################
// let n = dv.date("2022-07-18");
let n = luxon.DateTime.now(); 


// M11. Define filtered_tasks: gather all relevant tasks
// #####################################################################
let filtered_tasks = dv
    .pages(
        '"100_Project/01_dataviewjs/01_by_example/Q13_Tasks_groupBy/Q13_test_data"'
    )
    .file.tasks.filter(
        (t) =>
            t.due && 
            Math.floor(n.diff(t.due, "days").days) == 0 && 
            !t.completed
    );


// M13. GROUP BY task.r:
// #####################################################################
for (let related of filtered_tasks.groupBy((t) => t.r)) {
    dv.header(2, related.key);
    dv.taskList(
        filtered_tasks.filter((t) => t.r == related.key),
        false
    );
}

```


Screenshots(DVJS10)

let n = dv.date(“2022-07-18”);


DVJS20_bug_Tasks_groupBy_r

Summary

Main DVJS

Code Name Data type Purposes Remark
DVJS20
_bug
_Tasks
_groupBy_r
t.r:
1.a string
2.a link
1.The original bug is fixed.
2.A new bug occurs.
3.The codes are refactored.
1.easier to read
2.easier to modify
Summary_code

Code DVJS20_bug_Tasks_groupBy_r

title: DVJS20_bug_Tasks_groupBy_r =>1.The original bug is fixed. 2.A new bug occurs. 3.The codes are refactored.
collapse: close
icon: 
color: 
```dataviewjs
// M09. Define n:
// #####################################################################
// let n = dv.date("2022-07-18");
let n = luxon.DateTime.now();


// M11. Define filtered_tasks: gather all relevant tasks
// #####################################################################
let filtered_tasks = dv
    .pages(
        '"100_Project/01_dataviewjs/01_by_example/Q13_Tasks_groupBy/Q13_test_data"'
    )
    .file.tasks.filter(
        (t) =>
            t.due && 
            Math.floor(n.diff(t.due, "days").days) == 0 && 
            !t.completed
    );


// M13. GROUP BY task.r:
// #####################################################################
for (let related of filtered_tasks.groupBy((t) => t.r)) {
    dv.header(2, related.key);
    dv.taskList(
        // Edited by Justdoitcc 2022-07-18
        //filtered_tasks.filter((t) => t.r == related.key),
        filtered_tasks.filter((t) => dv.func.contains(t.r, related.key)),
        false
    );
}

```


Screenshots(DVJS20)

let n = dv.date(“2022-07-18”);


DVJS30_Tasks_groupBy_r_typeof

Summary

Main DVJS

Code Name Data type Purposes Remark
DVJS30
_Tasks
_groupBy_r
_typeof
t.r:
1.a string
2.a link
1.The new bug is fixed.
2.The codes are refactored.
1.easier to read
2.easier to modify
Summary_code

Code DVJS30_Tasks_groupBy_r_typeof

title: DVJS30_Tasks_groupBy_r_typeof =>1.The new bug is fixed. 2.The codes are refactored.
collapse: close
icon: 
color: 
```dataviewjs
// M09. Define n:
// #####################################################################
// let n = dv.date("2022-07-18");
let n = luxon.DateTime.now();


// M11. Define filtered_tasks: gather all relevant tasks
// #####################################################################
let filtered_tasks = dv
    .pages(
        '"100_Project/01_dataviewjs/01_by_example/Q13_Tasks_groupBy/Q13_test_data"'
    )
    .file.tasks.filter(
        (t) =>
            t.due && 
            Math.floor(n.diff(t.due, "days").days) == 0 && 
            !t.completed
    );


// M13. GROUP BY task.r:
// #####################################################################
for (let related of filtered_tasks.groupBy((t) => t.r)) {
    dv.header(2, related.key);
    dv.taskList(
        // Edited by Justdoitcc 2022-07-18 21:05
        //filtered_tasks.filter((t) => t.r == related.key),
        
        // Edited by Justdoitcc 2022-07-18 21:30
        //filtered_tasks.filter((t) => dv.func.contains(t.r, related.key)),
        filtered_tasks.filter((t) =>
            dv.func.choice(
                dv.func.typeof(t.r) === "link",
                dv.func.contains(t.r, related.key),
                t.r === related.key
            )
        ),
        false
    );
}

```


Screenshots(DVJS30)

let n = dv.date(“2022-07-18”);


DVJS40_Tasks_groupBy_r_overdue

Summary

Main DVJS

Code Name Data type Purposes Remark
DVJS40
_Tasks
_groupBy_r
_overdue
t.r:
1.a string
2.a link
1.To display tasks which are I_MAX_TODAY_MINUS_DUE days overdue and not yet completed
2.To groupBy task.r
3.The codes are refactored.
1.easier to read
2.easier to modify
Summary_code

Code DVJS40_Tasks_groupBy_r_overdue

title: DVJS40_Tasks_groupBy_r_overdue =>1.To display tasks which are `I_MAX_TODAY_MINUS_DUE` days overdue and not yet completed 2.To groupBy task.r 3.The codes are refactored.
collapse: close
icon: 
color: 
```dataviewjs
// M09. Define TODAY:
// #####################################################################
// const TODAY = dv.date("2022-07-18");
const TODAY = dv.date("today");


// M10. Define I_MAX_TODAY_MINUS_DUE:
// #####################################################################
const I_MAX_TODAY_MINUS_DUE = 36500; // TODAY - t.due <= 36500 days


// M11. Define filtered_tasks: gather all relevant tasks
// #####################################################################
let filtered_tasks = dv
    .pages(
        '"100_Project/01_dataviewjs/01_by_example/Q13_Tasks_groupBy/Q13_test_data"'
    )
    .file.tasks
    .where(
        (t) =>
            t.due &&
            !t.completed &&
            TODAY - t.due >= dv.duration("0 days") &&
            // dv.date("today") - t.due <= dv.duration("36500 days")
            TODAY - t.due <= dv.duration(I_MAX_TODAY_MINUS_DUE + " days")

    );


// M13. GROUP BY task.r:
// #####################################################################
for (let related of filtered_tasks.groupBy((t) => t.r)) {
    dv.header(2, related.key);
    dv.taskList(
        filtered_tasks
            .where((t) =>
                dv.func.choice(
                    dv.func.typeof(t.r) === "link",
                    dv.func.contains(t.r, related.key),
                    t.r === related.key
                )
            )
            .sort(r, "asc"),
        false
    );
}


```


Screenshots(DVJS40)

const TODAY = dv.date(“2022-07-18”);


2 Likes

Thanks, @justdoitcc. I’m going to try it out.

1 Like

Here’s a slight addition: colorful bars.

dataviewjs source block:

```dataviewjs

// First, get all notes:
const notes = dv.pages();

// Now get three JS arrays of the three data categories from those notes:
const fitnessDataArray = notes.Fitness.array();
const writingDataArray = notes.Writing.array();
const nutritionDataArray = notes.Nutrition.array();

// Now let's create the sums of each of these data categories:
const fitnessSum = fitnessDataArray.reduce((partialSum, a) => partialSum + a, 0);
const writingSum = writingDataArray.reduce((partialSum, a) => partialSum + a, 0);
const nutritionSum = nutritionDataArray.reduce((partialSum, a) => partialSum + a, 0);

// ... and put those in an array for later visualization:
const dataArray = [fitnessSum, writingSum, nutritionSum];

// Now let's setup the data for the chart:
const chartData = {
   labels: ['Fitness', 'Writing', 'Nutrition'],
   datasets: [
      {
         label: 'Data from notes',
         data: dataArray,
         backgroundColor: [
            'rgba(192, 0, 128, 0.3)',
            'rgba(128, 192, 32, 0.3)',
            'rgba(32, 0, 192, 0.3)',
         ],
         borderColor: [
            'rgba(192, 0, 128, 1.0)',
            'rgba(128, 192, 32, 1.0)',
            'rgba(32, 0, 192, 1.0)',
         ],
         borderWidth: 2
      }
   ]
}

// Let's configure the chart:
const config = {
   type: 'bar',
   data: chartData
}

// Lastly, let's render the chart:
window.renderChart(config, this.container)
```

Hope this helps, @snowbiker100

6 Likes

@justdoitcc - works as expected.

Another follow-up question. I’ve observed that the headings created using dv.header() function don’t fold. Is it possible to make them?

Dataview_v0.5.39 can convert dataview results to properly formatted markdown.
Maybe it will do that sooner or later.


In addition, I add the final version: DVJS40_Tasks_groupBy_r_overdue.
1.let i_max_today_minus_due = 0;
=>
1.To display tasks which are 0 days overdue and not yet completed
2.To groupBy task.r


2.let i_max_today_minus_due = 10;
=>
1.To display tasks which are 10 days overdue and not yet completed
2.To groupBy task.r

2 Likes