Base: Add a Graph View (put graph view in base's view menu)

I believe the release of the new base plugin presents a great opportunity to revitalize and better integrate the graph view core plugin.

Use case or problem

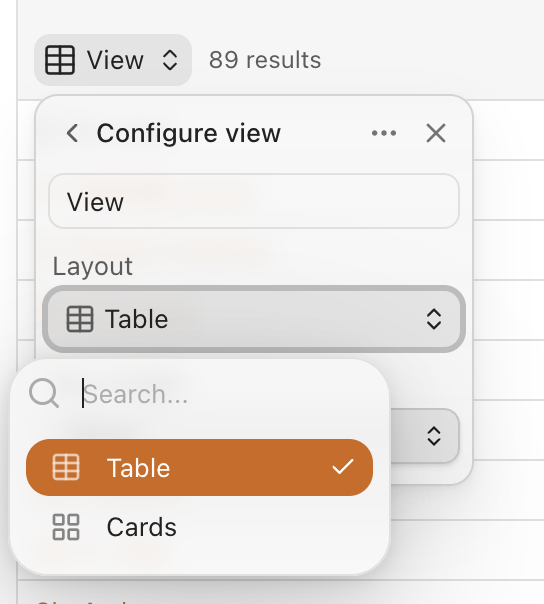
Currently, the base core plugin supports powerful view modes like Table View and Card View. I would love to see Graph View added as another native option within this framework.

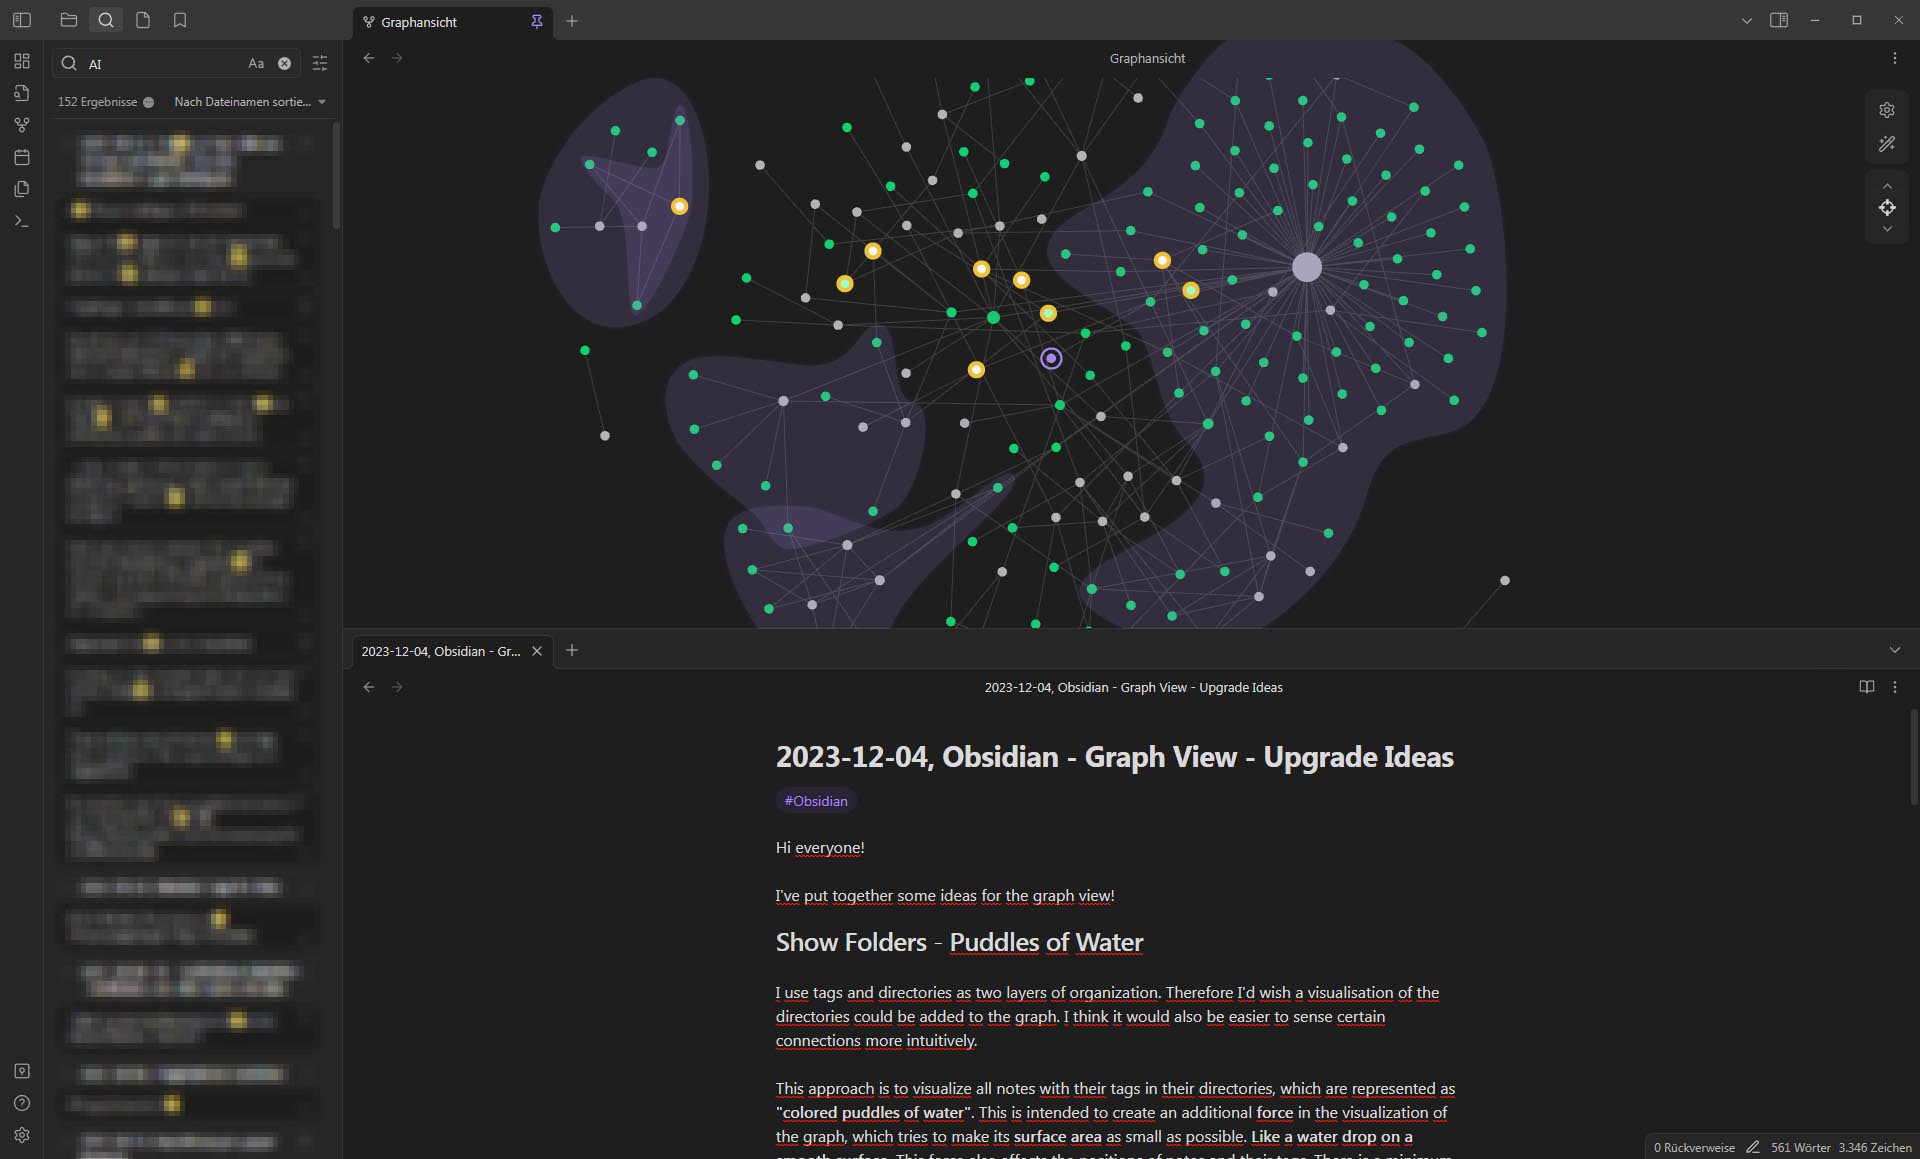
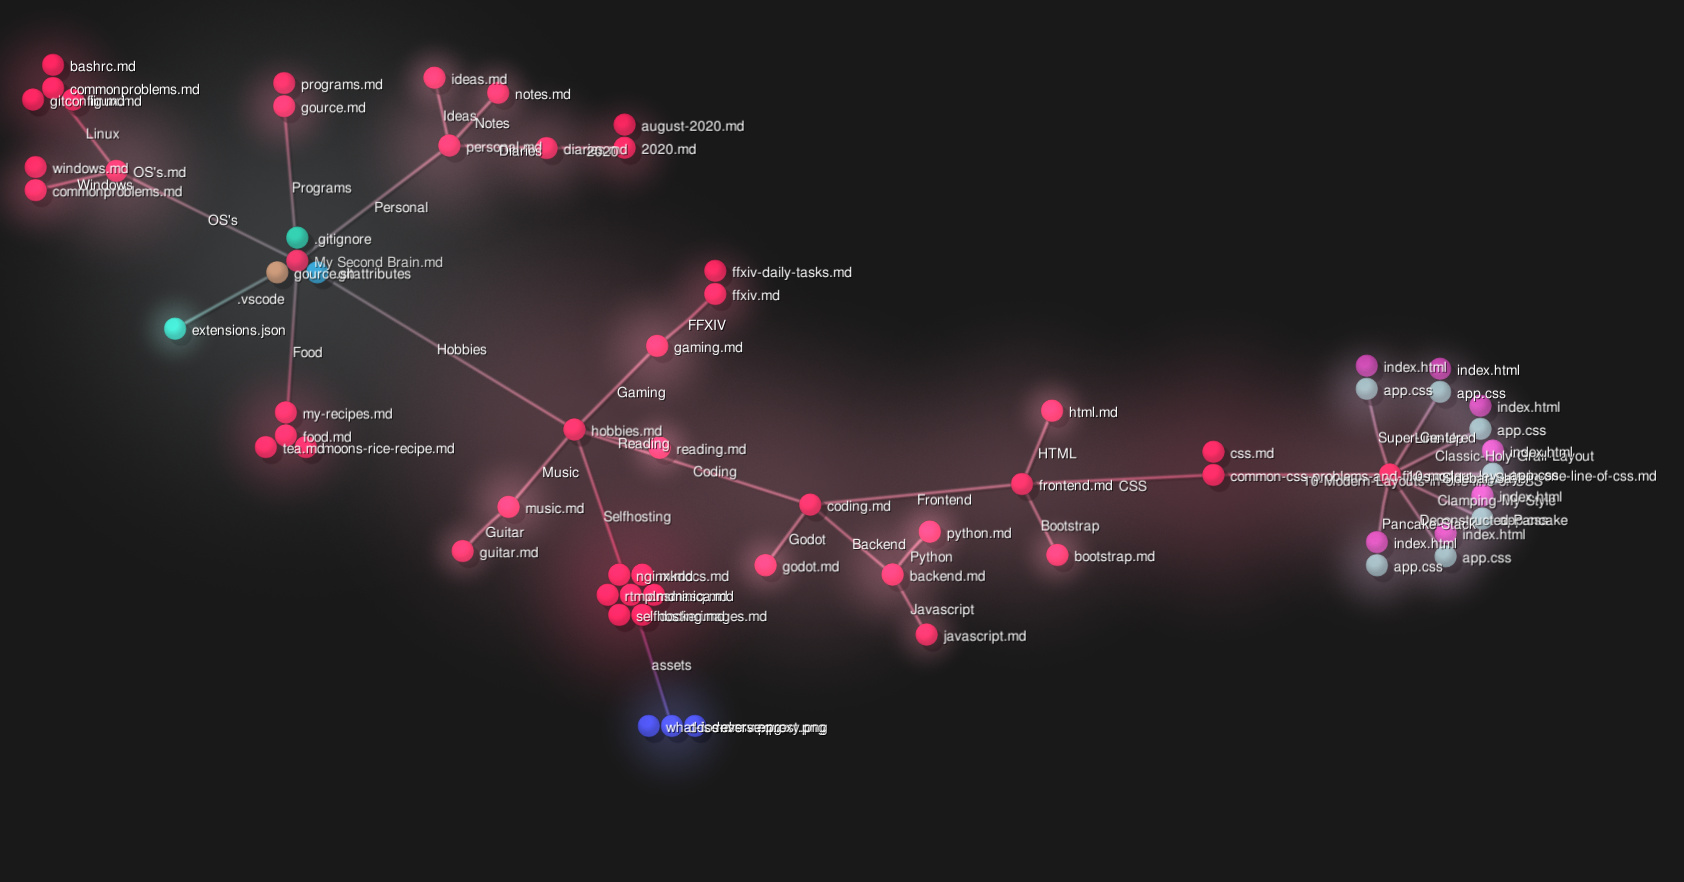
So the editor may looks like this. (Insert a .base file as graph view)


add the graph layout here

Proposed solution

Here are a few potential ways this could be approached:


Option A: Full Integration

  1. Merge the existing Graph View core plugin directly into the Base plugin. It would no longer be a separate plugin but would instead appear as a “Graph View” option in the view menu of the Base plugin, alongside “Table” and “Card”.
    • This takes advantage of the base plugin’s robust formula editing capabilities.

Option B: A Standalone, Embeddable Graph Filetype

  1. Rework the Graph View into a Base-like plugin. This would allow users to create standalone .graph files directly in the file browser. These .graph files could then be embedded into any Markdown note using standard wikilinks, just like any other note or attachment.
  2. This approach would require redesigning and enhancing the graph’s control menu to match the power and flexibility of the controls found in the Base plugin.

Option C: The Interim Solution

  1. Acknowledging that a full rework might take time, this option proposes keeping the Graph View plugin as it is for now, without major enhancements.
  2. The Base plugin would simply be adjusted to add a “Graph View” option to its view menu. This would act as a shortcut or entry point to the existing graph functionality, providing a more integrated feel without requiring an immediate, major overhaul.

Related feature requests (optional)

If we go ahead with this FR, there are a few other FRs that I think important

26 Likes

Currently you can embed the following things:

```query
```

See here

```base
```

See here

It would be really cool if Obsidian applied this same design principle for Graphs. There could be a .graph file just like there’s a .base file. And it would be a YAML definition of parameters in the Graph plugin. And there could be a graph code block just like there’s already a base code block.

7 Likes

Sorry, that was sort of unrelated. Anyhow, I really like your idea of of integrating the Graph View into the Base plugin. How would it work?

When I create a Graph View in my Base what happens? I think I’d expect the graph to only show node’s that are in the Base’s filter. But then I’d also like to be able to expand from that graph to see links and backlinks from those nodes.

4 Likes

Table view, card view, and graph view each serve different purposes by presenting distinct types of information.


Table view and card view are typically used to display metadata about the Markdown documents themselves. This includes properties like creation date, last modified date, cover, status, priority, and so on.


The graph view, however, is primarily designed to visualize the relationships between a document’s content and other documents. Consequently, the properties you would filter by in this view become topic, subtopic, or field.

Here are a few ways I envision this working:

  1. Filter by a broad topic: This would display a graph of all the interconnected documents under that theme (usually around 10-40 documents), revealing the bigger picture.
  2. Filter by a specific subtopic: This would show a more focused graph (this subtopic has fewer than 10 documents).
  3. Add a new command: insert local graph .

It’s clear that relying solely on table view and card view makes it impossible to represent these crucial, content-based relationships between documents.


Think of this as a tool for demonstrating your thought process. What truly matters is how you organize your notes, rather than the design of the plugin itself.

3 Likes

Another approach:

Enable local graph for bases.

Syntax

Embeded example

![[note.base#view1#local graph]]
or
![[note.base#view1|local graph]]

1 Like

Use case or problem

Obsidian bases has genuinely changed everything about my life more than any other feature/app has. For it to function with graph view would be amazing. The convenience of the filters of Bases as well as the visualization of a Local Graph would be game changing.

With longer running graphs with thousands or tens of thousands of nodes, a local view filtered by a base could make loading the graph view easier

Proposed solution

A new command for graph view:
Graph view: Open graph for base
Just an assumption of how this could be coded: iterate through each element of the current base and add the nodes to a graph view.

Current workaround (optional)

You could potentially (and painstakingly) try to recreate the bases filters with a search query, but oftentimes it can be impossible (for example when working with number ranges)

I would love to have a graph view in bases. In my head should work like this:

  • each node can be can displayed like a circle (if zero properties are selected) or like a card with some frontmatter properties. Nice to have is the coloring of nodes based on a property.
  • each edge should be generated based on a frontmatter property containing wiki-links to another note.
  • filtering is like in bases
  • group-by not easy to include, it might define the force between 2 nodes? or maybe just creates some artificial clustering between nodes even if they are not linked.

That’s it. Not sure how difficult it is but I think it would be great. I have in mind already some nice personal applications.

Whole heartedly agree with this feature request, having a graph view tied directly to a base instead of having to make a base, replicate the filtering in the graph view, and bookmark that view would be a very nice addition. This could also allow for functionality that I haven’t seen requested before: only generate links for the columns in the table.

Say I have a bunch of notes with up, down, prev, and next properties. For this view, I only want to show the relationships between up/down notes, not prev/next or links in the body of the note, so I include only those properties as columns in the graph view. Alternatively, if I want only the links across bodies of notes and not the properties, I’d use file.links as a column and no other property.

I also like the card suggestion, sounds almost like a cross between graph and canvas and could be helpful when skimming a bunch of related ideas in a Zettelkasten.

2 Likes

Having the ability to visualize and segment graph nodes based on a base’s filter would be truly amazing, I completely agree with this. It would provide the perfect middle ground between the “visual candy” aspect of the unfiltered global graph, and the granularity of the local graph, and truly give us powerful and dynamic ways to explore connections between notes based on the already neatly defined context of a base.

The simplest implementation I believe would be the local graph for base idea - and that would make me happy on its own, but I’m hopeful there’s more to explore about the idea.

1 Like

I am looking exactly for this feature. Thanks @raily

1 Like

I think the best way to go about implementing this would be in the Graph View core plugin, it would follow the same logic like the Maps View for bases, which also is a separate plugin for a specific view (released in the community plugins, but that’s beside the point). Only those who actually have enabled both the Bases and Graph View plugins would see the option of creating a Graph view in a Base.

All notes that pass the filters are shown, plus all nodes you specify for links. This would mean that if you were to filter on a folder, but notes in that folder link to notes in a different folder, those would still be displayed if you set the links to be that.

Embedding it in a note would be as easy as ![[file.base#Graph]] (or if it’s the default view of a base it would be ![[file.base]] like usual), and doing it in a code block would work as any other view too:

```base
views:
  - type: graph
    name: "Graph"
```

Taking inspiration from another feature request, groupBy could be easily done by either some kind of background “puddle”…

… or making the notes attract or repel each other depending on the group they are part of (in the below post the example of folders and sub-folders was used, imagine it were simple groups):

Idea: Links based on properties/formulas

To make even more use of graph views, the idea of customising what it is that defines the connection came to me too. Similar to what @adrian17050 suggested:

Using slashes to denote nesting

Just like in nested tags (#topic/subtopic) or file paths (Folder/Sub-Folder/File.md), the / (slash) could be interpreted as a new layer, making it easy to make a graph view based on folder structure:

Idea: Controlling force strengths through properties/formulas

I made a base for myself that shows related notes, even if they don’t directly link to one another. I use a value to determine whether it is related enough to be shown in the base, and it’s used for sorting too.

This is a simple number, and it would be cool if such a calculated number can be used to set the attraction forces for each node with the node it is attached to. This is a loose idea, but one that would make the distances between nodes in the graph view informative too.

2 Likes

More ways to visualise local graph would be awesome. Currently in Android is too cumbersome to have it on any of the sidebars because I “lose“ the outline and other tabs like search/calendar that I need more accessible. This happens cause I haven’t found a way to have multiple ‘tabs” opened in the sidebars on mobile (in desktop is really easy).