I use tags and directories as two layers of organization. Therefore I’d wish a visualisation of the directories could be added to the graph. I think it would also be easier to sense certain connections more intuitively.
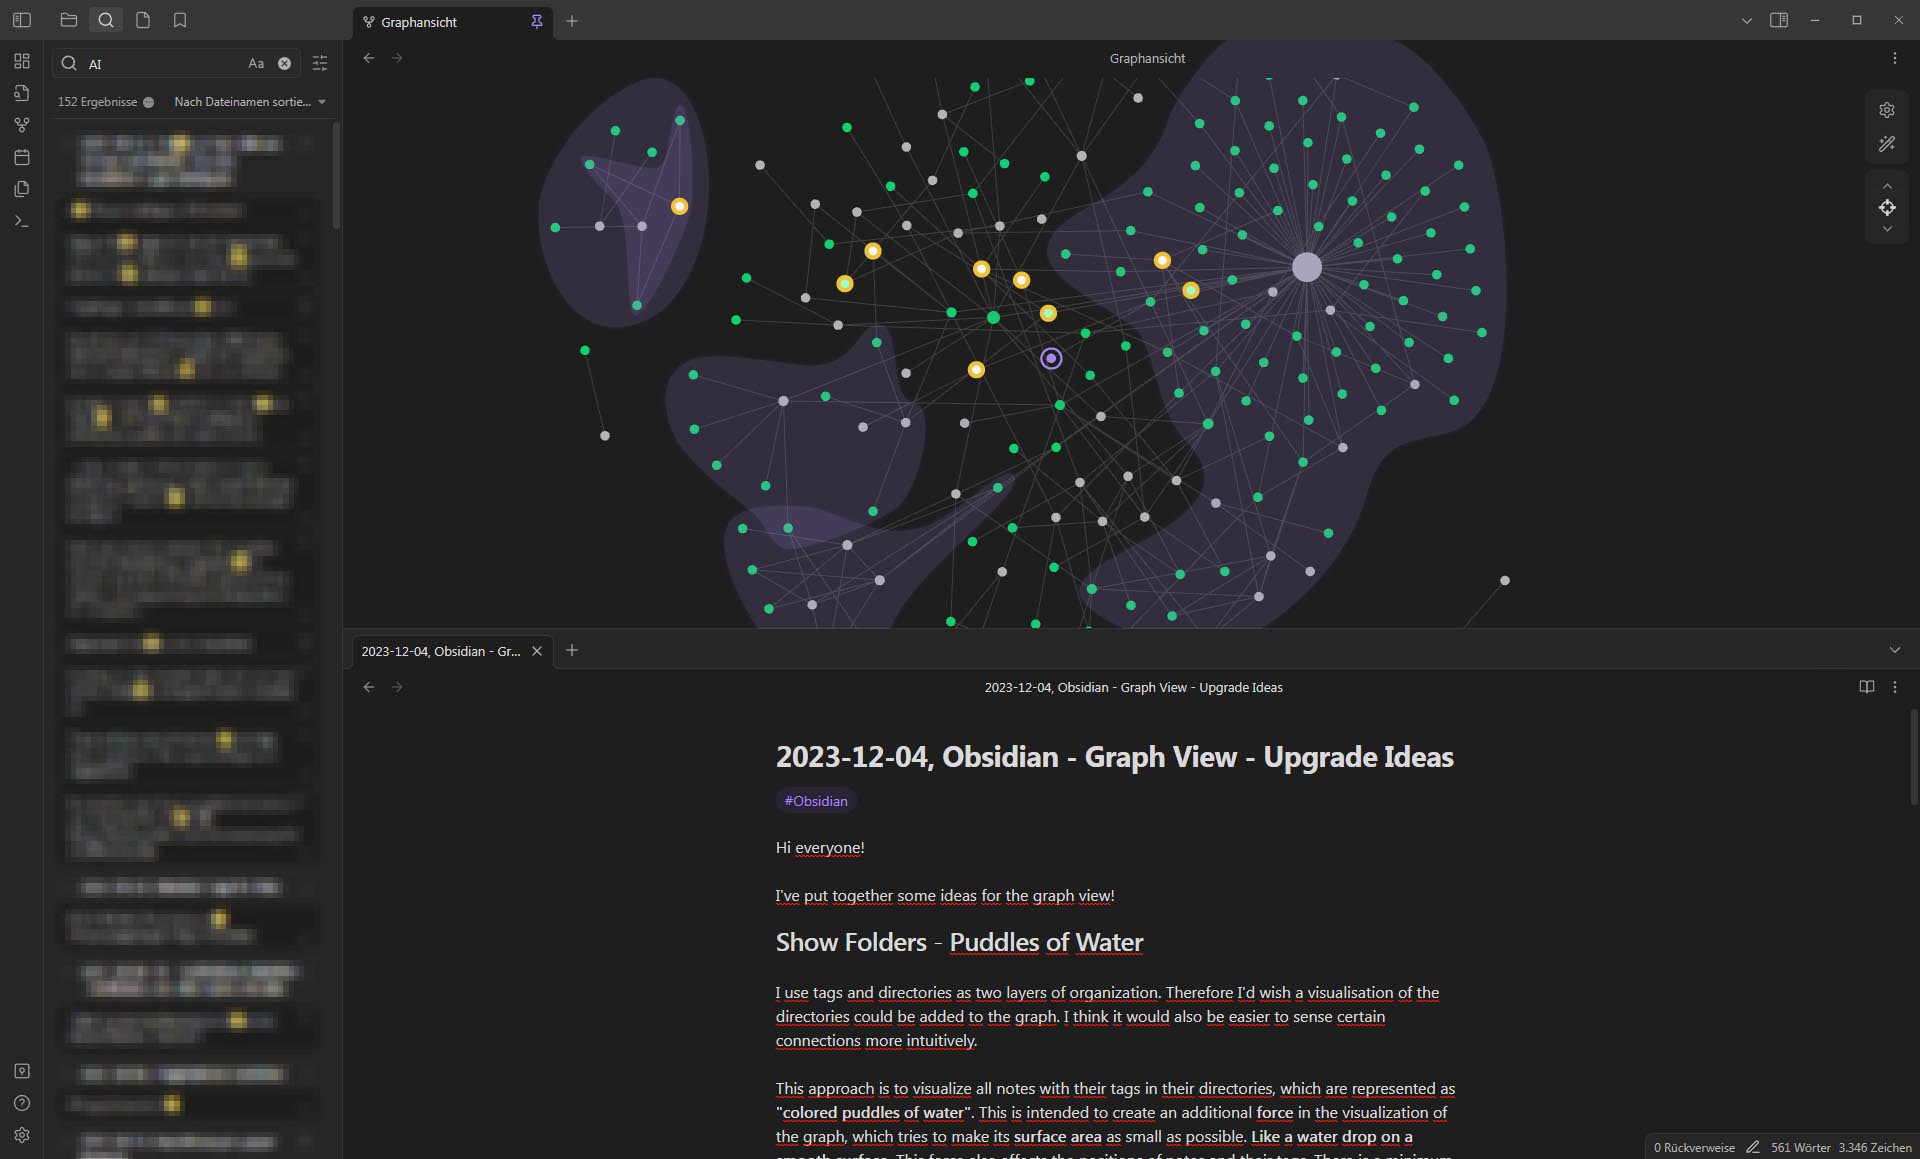
Show Folders - Puddles of Water
This approach is to visualize all notes with their tags in their directories, which are represented as “colored puddles of water”. This is intended to create an additional force in the visualization of the graph, which tries to make its surface area as small as possible. Like a water drop on a smooth surface. This force also affects the positions of notes and their tags. There is a minimum distance between the edge line of a drop and a node. These puddles of water will overlap where notes share tags.
The color of the puddles is suggested somewhat transparent, which highlights the overlapping areas well. Subdirectories can also be displayed in this way. In order to be able to display any number of subdirectories, the most transparent color value with the most opaque color value would have to be gradually divided into the number of directory levels that occur.
I think the formation of the puddles would be a very nice effect.
Best,
Mutzu