File truncated on Obsidian crash (out-of-memory from reindexing triggered by typing)

Steps to reproduce

Note that I’m not 100% certain whether this is caused by a plugin. I’m running with most plugins disabled but, it’s possible. This said, Obsidian shouldn’t crash, shouldn’t flush a partial buffer to disk and should have reasonable logging and at least a crash log.

This has happened several times in the past and twice last night and today losing all work twice.

Basically obsidian crashes (grays out)
In the process wipes half the file.

Everything is frozen, except for the top menu. The edit menu only shows a “Redo” action (i.e. no undo).

No, I’m not using the Obisidian file recovery because it doesn’t work (I opened a separate issue for that, but basically it crashes after a certain size.
Also note that having a file recovery option is not an actual fix to the problem of losing data as suggested here Data loss - zero byte .md file in vault - #7 by macedotavares

Did you follow the troubleshooting guide? [Y/N]

No, it’s not practical to try this, it happens sometimes a few times per hour or it can take days.
Instead of forcing everyone to do this, there should be be better logging on what’s actually happening. It would save everyone a ton of time and frustration.

Expected result

My expectation, and I’m sure this has been the expectation since the first digital editor existed, is that I’m not going to lose my buffer. Before Obsidian, I haven’t lost a buffer since 90s before word didn’t do autosave.

Actual result

20K lines deleted. Luckily I use git and only a few hundred lines with todays work are lost.

Environment

SYSTEM INFO:
	Obsidian version: v1.7.0
	Installer version: v1.6.7
	Operating system: Darwin Kernel Version 23.5.0: Wed May  1 20:12:58 PDT 2024; root:xnu-10063.121.3~5/RELEASE_ARM64_T6000 23.5.0
	Login status: logged in
	Catalyst license: supporter
	Insider build toggle: on
	Live preview: on
	Base theme: light
	Community theme: Minimal v7.3.2
	Snippets enabled: 4
	Restricted mode: off
	Plugins installed: 44
	Plugins enabled: 8
		1: Hotkeys for templates v1.4.3
		2: Excalidraw v2.3.0
		3: Quick Switcher++ v4.4.0
		4: BRAT v1.0.1
		5: Git v2.25.0
		6: Remember View State v1.0.12
		7: Simple CanvaSearch v1.0.0
		8: Canvas Link Optimizer v1.2.0

RECOMMENDATIONS:
	Custom theme and snippets: for cosmetic issues, please first try updating your theme and disabling your snippets. If still not fixed, please try to make the issue happen in the Sandbox Vault or disable community theme and snippets.
	Community plugins: for bugs, please first try updating all your plugins to latest. If still not fixed, please try to make the issue happen in the Sandbox Vault or disable community plugins.


Additional information

Related
I don’t see any steps to reproduce here. In what circumstances does this happen? Do the affected files have any characteristics in common? At the bottom of the post you mention 20K lines lost which suggests unusually large files.

Moved to Help.

Luckily, Obsidian is not an app that crashes frequently. Almost all the cases of partial buffer flushes have happened because the user’s computer crashed and the file recovery plugin handled those cases well.
Nevertheless, we could implement a double buffer/shadow file approach. You can open a Feature Request for that.

1 Like

@CawlinTeffid it often happens when I’m simply typing text. I often have the file open in multiple splits. Sometime the global search is on and I noticed typing can retriever global searches. I suspect the size increases the chance, but shouldn’t be a cause in itself.

But, repeating myself, asking for reproduction steps, just prevents users from reporting the problem, it doesn’t make the problems go away. There is logging and stack traces and a crash reporting and a ton of good telemetry and crash aggregation tools like Sentry for a reason crashReporter | Electron.
I don’t understand why debating reproduction steps is a user responsibility with none of these.

@WhiteNoise unless you have telemetry or a crash report option, there’s no proper way to assess whether it crashes often or not. For me, for some reason, when it starts to crash it crashes often. Usually, I restart it before it crashes as it gets slow.

Also file recovery was great while it worked. Unfortunately it crashes when I try to open a larger file. It seems to compute all diffs and likely runs out of memory. It should only do the last few ones. Perhaps that could fix it.

It’s the app’s javascript that is crashing, not electron. Some the tools you are pointing out would not work.
Also we do not bundle any form of telemetry software as choice to respect user’s privacy.

I’ll double check this.

Thanks @WhiteNoise. I have genuine respect for your care of privacy.
While I don’t understand how traces which are a representation of your programs’ flow are a violation of privacy, pushing any data out regardless what it is should be done with the user’s consent.

This doesn’t mean you shouldn’t do everything at least locally.
So please give users an option to:

  • see the data themselves
  • share it with you if the choose so

I’ll double check this.
:raised_hands:

This just happened again. This time without a crash.
I renamed a heading and after the rename the editor got sluggish, so I quit Obsidian as this fixes the problem). Obsidian UI quit, but the icon was still visible as an open app and a huge chunk got deleted.

I believe this is the same problem that causes the heading rename corruption Heading rename deletes arbitrary data, inserts garbage around heading links - briefly after a heading rename, there’s a race condition on the active buffer.

It happened to me on Windows just now. No crash, just the app got sluggish.

  • I have been recently monitoring Obsidian CPU and RAM consumption behavior and took me some 2-3 weeks to get it sort of under control but looks like the problem can arise still (in other ways).

When I checked the file (1.5kb in size) in question in a text editor, it came up empty. Git diff (using GitHub Desktop’s GUI) also showed the file devoid of any lines (was all red).
To my surprise, I was not using Live Preview at the time, which is one of my top candidates for causing any type of RAM resource hogging mayhem.

  • Others include: Graph plugins (core and external), Dataview (not been updated for a long time, so I ruled it out; although on this occasion I was editing a markdown file containing a DVJs script, so maybe I should have waited for it to run before abruptly switching to Source Mode??)

I started being aware of my problems around early or mid-August and Obs. ver. 1.6.7 came out on Jul 18.
I cannot afford to be using a vault without external plugins or snippets for long and I don’t have good diagnostics skills (or any more time I’d be willing to put into this) so I can never get around to nailing this, I reckon…
So all I’m really doing here is bumping this.
This could be an Electron thing…?
Hopefully, there’ll be some kind of remedy about this in the coming releases…

I doubt it’s an Electron thing (VSCode is Electron).

Moreover, even provided it’s a “plugin problem” it’s still a core Obsidian problem as nothing else should be allowed to race for the file buffer regardless. But even so, I highly doubt there’s another plugin (I also disabled all non-essential plugins) that’s messing the file up.
I suspect the only influence, external plugins may have on this is that they can add latency that can increase the frequency.

So, my bet is that his is a core Obsidian bug, causing it to lose data.

Moreover the fact that there’s literally zero context (no logs, no crash report, nothing to help pinpoint these issues) is highly ignorant/reckless.

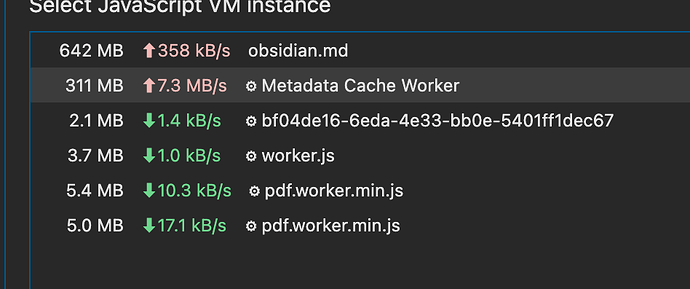
Identified one cause is OOME (out of memory error) from search / indexing.

I’ve been running with developer console open and I keep getting pauses (as with breakpoints) - with “Paused before potential out-of-memory crash”

This is in conjunction to an app notification “Indexing taking a long time for ”

I’m assuming Chrome detect the memory spike, suspects an imminent OOM and pauses the thread. This is followed by some timeout that triggers the notification.

It’s unclear, but thinkable, why indexing would OOM.
However it seems indexing is not incremental and triggered by edits / key presses?

“Indexing taking a long time for …” means the the note is complex.
Do you have a copy of this note that you can share or DM me?

“Indexing taking a long time for …” means the the note is complex.

The debugger pauses the indexing process and triggers the warning. It doesn’t normally show up, without the debugger pausing it.

I can’t share my notes, unfortunately.

However a few questions

  • reindexing entire files seems weird - is that the case?
  • is the OOME just from indexing a single markdown file? Seems abnormal that it would use that much RAM, is it inefficient or leaky? This is normal usage

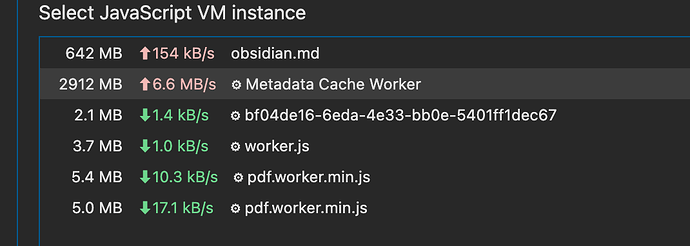
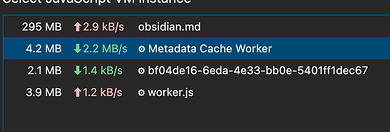
    I’m seeing the cache worker spiking to over 2.4GB
  • is there a way to allocate more RAM to test if it’s just not enough vs a leak?

Thanks!

I want to clarify that I’m not getting truncations with these.
As I mentioned earlier sometimes the file gets truncated, and it’s usually (I believe always) in conjunction with a slowdown like this.

yes, a note is reparsed in its entirety after it is modified.

Generally, Obsidian is limited at 4 GB of memory on desktop. I think I tried one time to use some electron command line switch to increase this number but I don’t recall if it worked or not.

yes, a note is reparsed in its entirety after it is modified

What’s weird is that the slowdown is generally progressive. Combined with the OOM,

  • I wonder if more than one indexing process may run at the same time.
  • also Is the indexing blocking the editor mutations while running, or is it just CPU contention that causes the slowdown?

Finally, while incremental indexing would be ideal, I think an easy workaround would be to reindex when the user stops typing (e.g. focus changes / leaf changes).

  • I wonder if more than one indexing process may run at the same time.

no

  • also Is the indexing blocking the editor mutations while running, or is it just CPU contention that causes the slowdown?

no

I’m not sure I understand what you are referring to.
I would go back to what plugins you have enabled.

  • Remember View State v1.0.12
    • If this does the same as the Remember Cursor Position plugin, I had to disable the latter as it caused some leak you are referring to.
  • Excalidraw is also doing some indexing but admittedly only after startup

Off topic: you don’t need CanvaSearch if you have QuickSwitcher++ as the latter can search in canvases as well.

Thanks - it looks like a single run can allocate 2.6GB
I took this when it got auto-paused by Chrome dev tools with OOM warning


This is immediately after

Note the file names are weird like they’d be in reverse order, but they are not.

I don’t think I can give Electron more RAM. I tried but I suspect it’s using pointer compression and capped at 4GB - node.js - After upgrading Electron from 1 to 10, the --max-old-space-size command can't set a value larger than 4GB - Stack Overflow

Here’s how it looks for my file - different snapshots sizes worker footprint

markdown size worker size (MB)
553 KB 63
1.4 MB 482
1.8 MB 965
2.1 MB 1500
2.5 MB 2035
2.7 MB 2630

I tried it in sandbox with all plugins disabled and it’s 2.9GB
I also used the previous test file. It’s slightly better (assuming less complexity) but will OOME at 6.5MB
I guess you can document a max 3-5MB file (although it’s clearly not just the file size, but also the complexity (headings, links, code blocks?)

I’ll try to resummarize points / questions

  • link between indexing and data loss is not proven
  • indexer allocates 1000:1 indexer-to-markdown ratio - is this normal?
  • indexer runs for several seconds
  • it’d be nice to optionally have it run less often, like when the user stops typing / changes focus to avoid cursor latency and reduce the risk to overlap with other threads.
  • ideally indexing should be incremental. There are minimal changes during edits, so reindexing the whole file is a huge waste of resources and screws latency
  • Is indexing across files concurrent? can the heading rename, trigger concurrent indexing across files? - this may be linked to that issue too.

Finally, for the actual data corruption, it’d be good to check what gets access to the file buffer . While the indexer could be a good candidate for the slowdown that could make other issues manifest, there must be a buffer write race condition that causes the actual corruption.

Thanks, @Yurcee - remember view state is my own plugin :slight_smile: (after trying others too) and minimal (Persistent editor / view state on restart)

This said, the memory is allocated to “Metadata Cache Worker” not obsidian.md process and the usage is consistent in the sandbox with all plugins disabled (that is all including all core plugins) - see my last comment for more details.

I really don’t think it’s the markdown file size. As I test with the bibble sometimes.

Without actually seeing your vault, it hard to draw any conclusion.