Hi, I am Using the “Reminder” plugin with which my Tasks/to dos look like this:
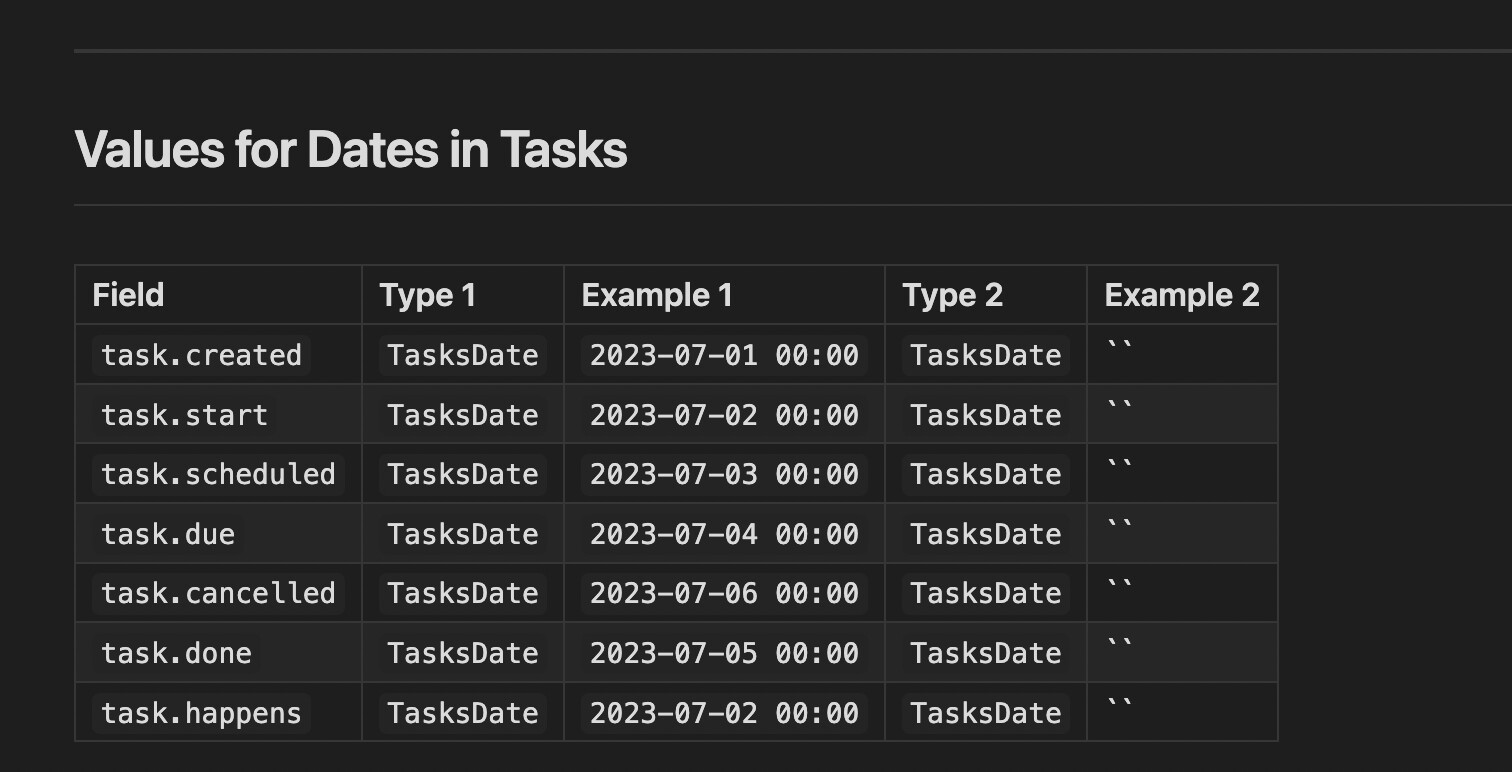
- [ ] "Some random Task" ⏰ YYYY-MM-DD 📅 YYYY-MM-DD
in this configuration “ YYYY-MM-DD” is the Due date or reminder date and “
 YYYY-MM-DD” is the date on which the task was originally issued.
A completed tasks looks like:
- “Some Random Task”
 YYYY-MM-DD
Where YYYY-MM-DD is the date on which the task is compleded.
Further, I often (espacially in my daily notes, I use “nested tasks” i.e. something like:
- “Some random Main-Task” YYYY-MM-DD YYYY-MM-DD
- “Some random Sub-Task” YYYY-MM-DD YYYY-MM-DD
- “Some Random already completed Sub-Task” YYYY-MM-DD
With this background and the code provided below, I have the following issues:
Issue A: The heat map is somehow disregarding the dates on completed “Sub-Tasks” and is counting them also for later days. I am not 100% sure but I think it is only for those in the daily note. For example today, “sub tasks” that were completed last week are still counted if the main task is not yet completed in the daily note.
Issue B: I would like to have a heat map for how many tasks are due in future. i.e. that (in a different block) the plugin is counting how many tasks have their due date ( YYYY-MM-DD) as a specific time in future and is displaying a heat map for , lets say the next 6 month or year.
for all this, I would like the plugin to consider every task globally regardless if from meeting notes, dailies or whatever else.
Here is the code I am using right now:
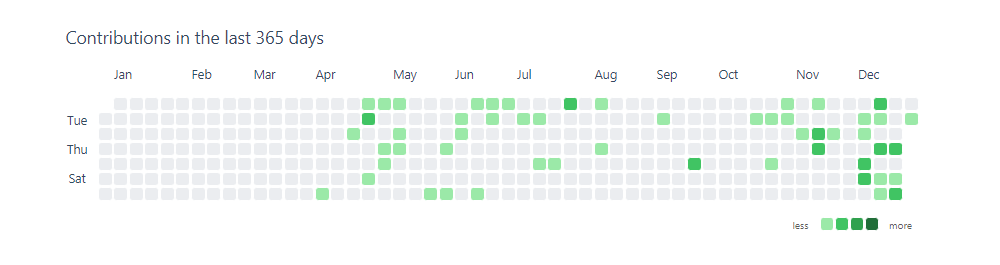
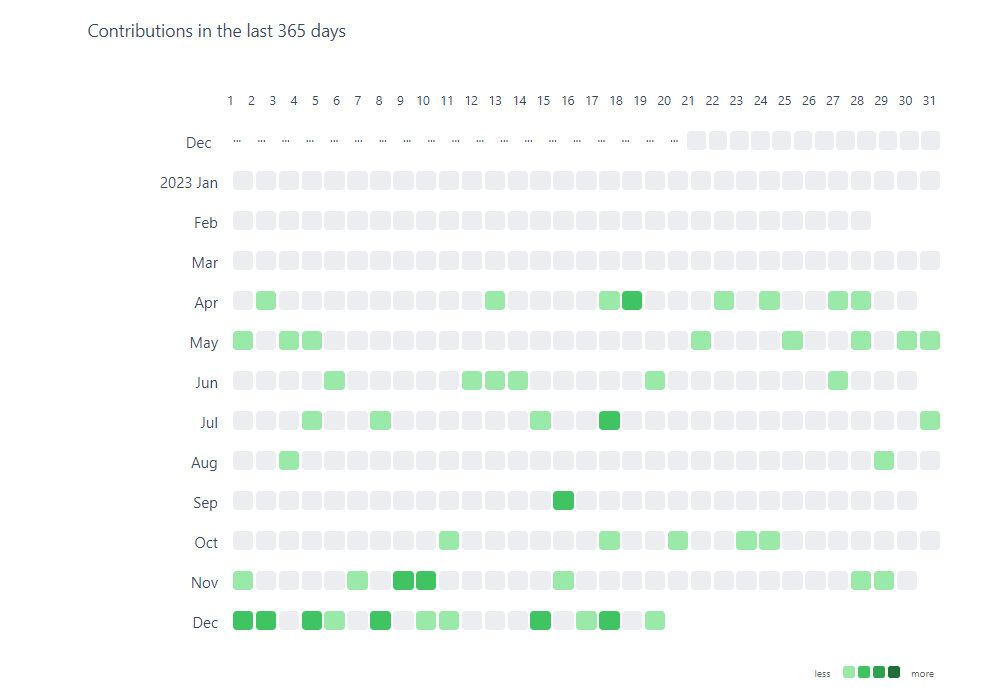
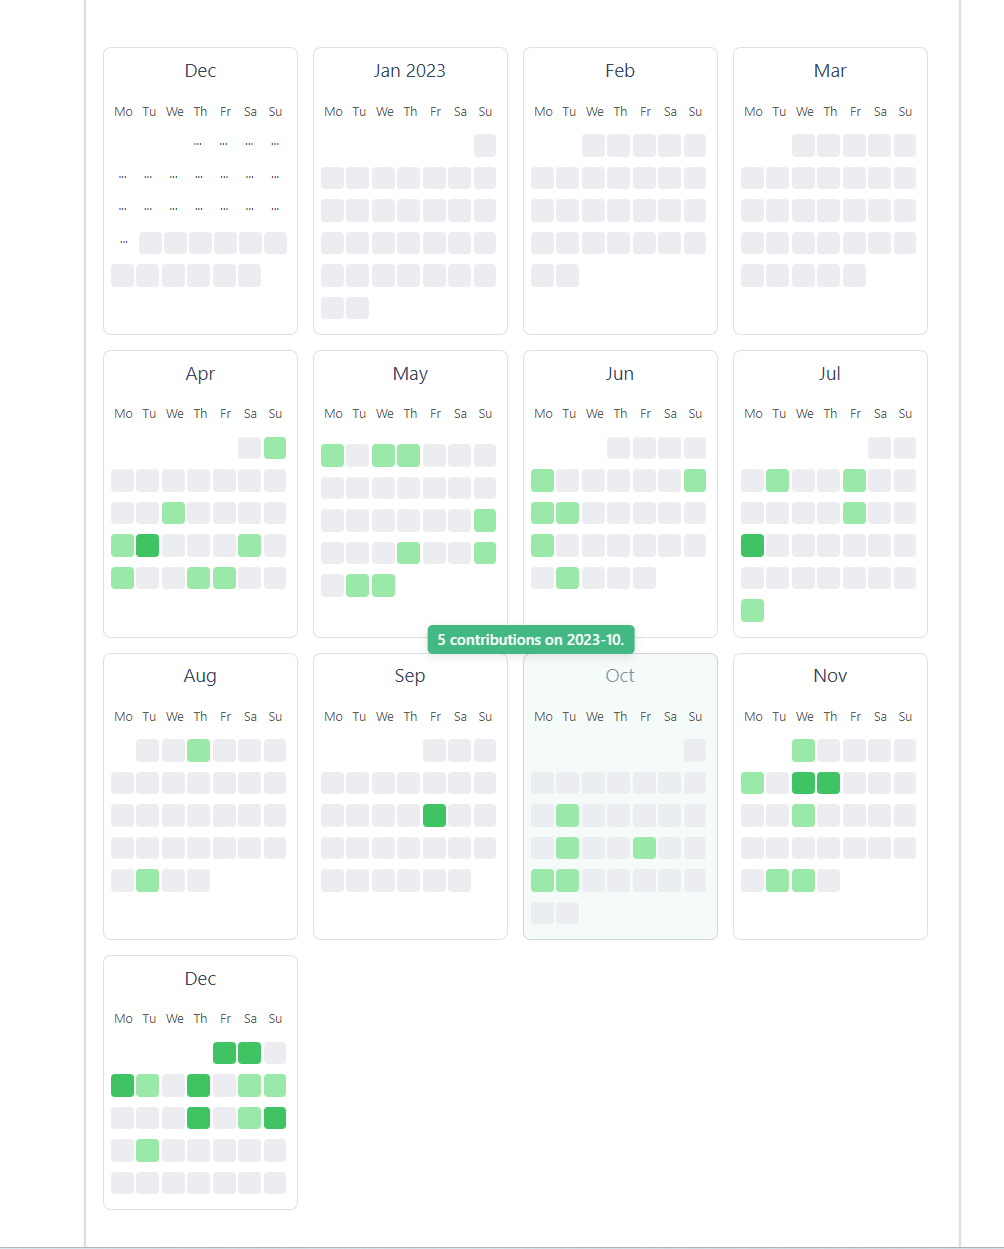
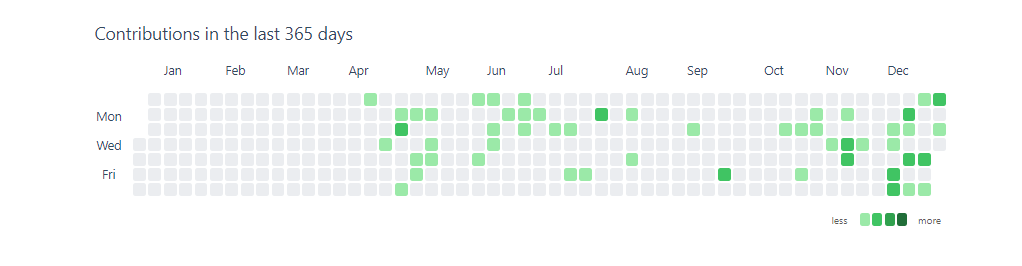
title: Tasks Completed
graphType: month-track
dateRangeValue: 2
dateRangeType: LATEST_YEAR
startOfWeek: 0
showCellRuleIndicators: true
titleStyle:
textAlign: left
fontSize: 15px
fontWeight: normal
dataSource:
type: ALL_TASK
value: ""
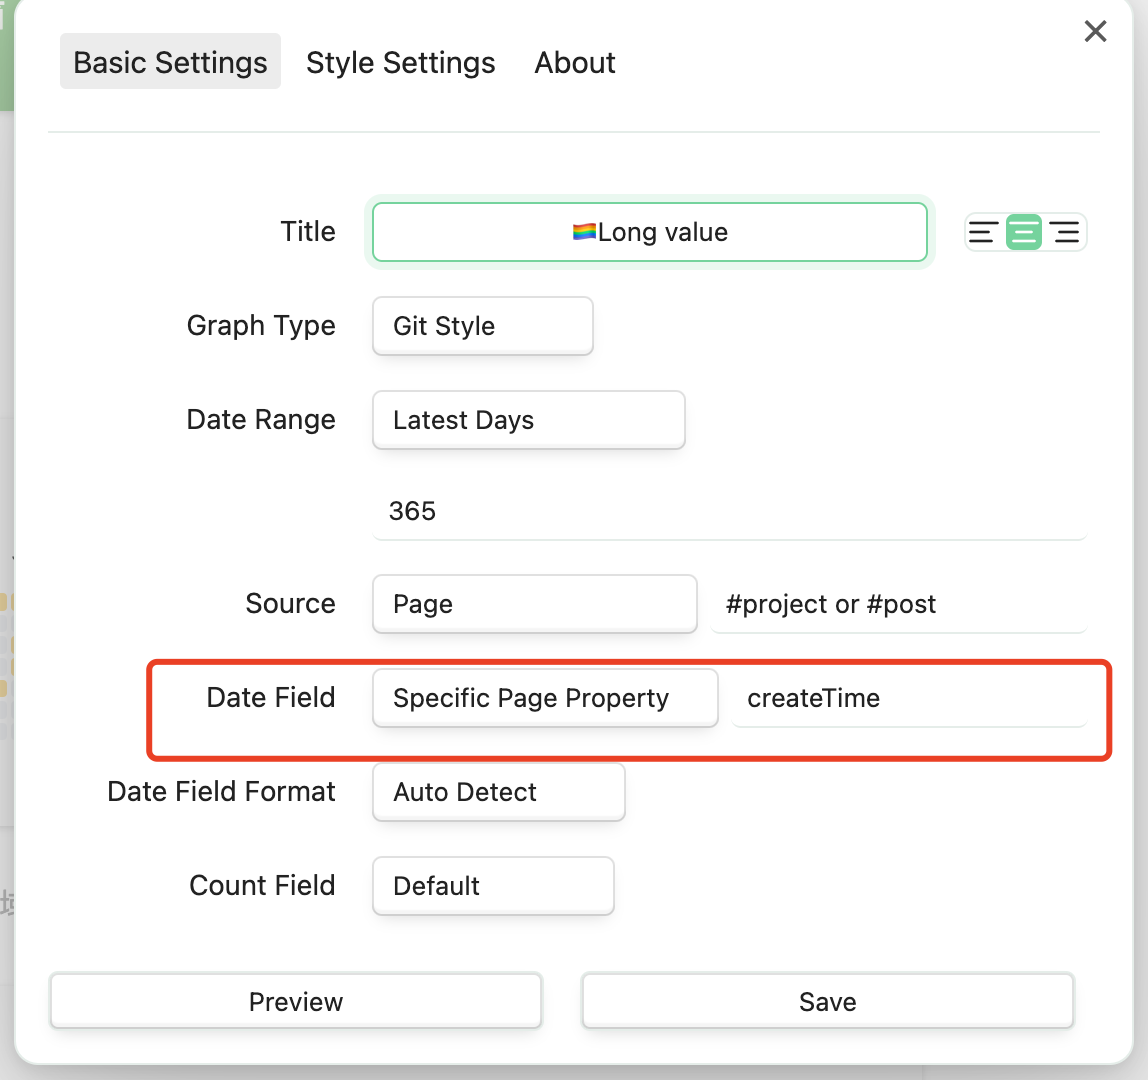
dateField:
type: FILE_CTIME
value: completed
filters:
- id: "1722233363578"
type: STATUS_IS
value: COMPLETED
fillTheScreen: true
enableMainContainerShadow: false
cellStyleRules:
- id: 1722196093823
min: "1"
max: "10"
color: "#63aa82"
text: ""
- id: Halloween_a
color: "#fdd577"
min: "10"
max: "20"
- id: Halloween_b
color: "#faaa53"
min: "20"
max: "30"
- id: Halloween_c
color: "#f07c44"
min: "40"
max: "50"
- id: Halloween_d
color: "#d94e49"
min: "60"
max: "70"
- id: 1722195684421
min: "70"
max: "999"
color: "#7c0793ff"
text: ""
cellStyle:
minHeight: 10px
minWidth: 10px
mainContainerStyle:
boxShadow: rgba(0, 0, 0, 0.16) 0px 1px 4px