Hi there @anon63144152, here are some queries for you to ponder over, and maybe spend even more hours on studying! 
## Base query
```dataview
TABLE P1, P2
WHERE file.folder = this.file.folder
  AND file != this.file
```

## Grouped by file
```dataview
TABLE
  rows.P1, flat(rows.P1), sum(flat(rows.P1)),
  rows.P2, flat(rows.P2), sum(flat(rows.P2))
WHERE file.folder = this.file.folder
WHERE P1 OR P2
GROUP BY file.name as GamesPlayed
```

## Every game with game count(?)
```dataview
TABLE WITHOUT ID P1Wins, P1Count, P2Wins, P2Count,
 "<progress value='" + round(100 * P1Wins / (P1Wins + P2Wins), 0) + "' max='100'>" as "Percentage P1",
 "<progress value='" + round(100 * P2Wins / (P1Wins + P2Wins), 0) + "' max='100'>" as "Percentage P2"

WHERE file.folder = this.file.folder
WHERE P1 OR P2
GROUP BY true
FLATTEN sum(flat(rows.P1)) as P1Wins
FLATTEN sum(flat(rows.P2)) as P2Wins
FLATTEN length((rows.P1)) as P1Count
FLATTEN length((rows.P2)) as P2Count
```


## With totals
```dataviewjs

function highlight(value) {
  return "**" + value + "**"
}

const result = await dv.query(`
  TABLE
    sum(flat(rows.P1)) as "Player 1",
    sum(flat(rows.P2)) as "Player 2"
  WHERE file.folder = this.file.folder
  WHERE P1 OR P2
  GROUP BY file.name as GamesPlayed
`)

if (result.successful) {
  let p1sum = 0
  let p2sum = 0

  dv.array(result.value.values)
    .forEach(v => {
      p1sum += v[1]
      p2sum += v[2]
    })

  result.value.values.push([highlight("Total"), highlight(p1sum), highlight(p2sum)])

  dv.table(result.value.headers, result.value.values)
} else
  dv.paragraph(`~~~~\n${ result.error }\n~~~~\n`)
```
Some comments on the various queries, where the base query is the first:
Here we can see that my test setup has four files, one with no mention of P1/P2, One game with one mention, so it’s a single value, and Two game and Three game with two and three values of the P1&P2 combo. I’m not quite what these mention correspond to, I reckon maybe different game sessions during that particular day or something like that?
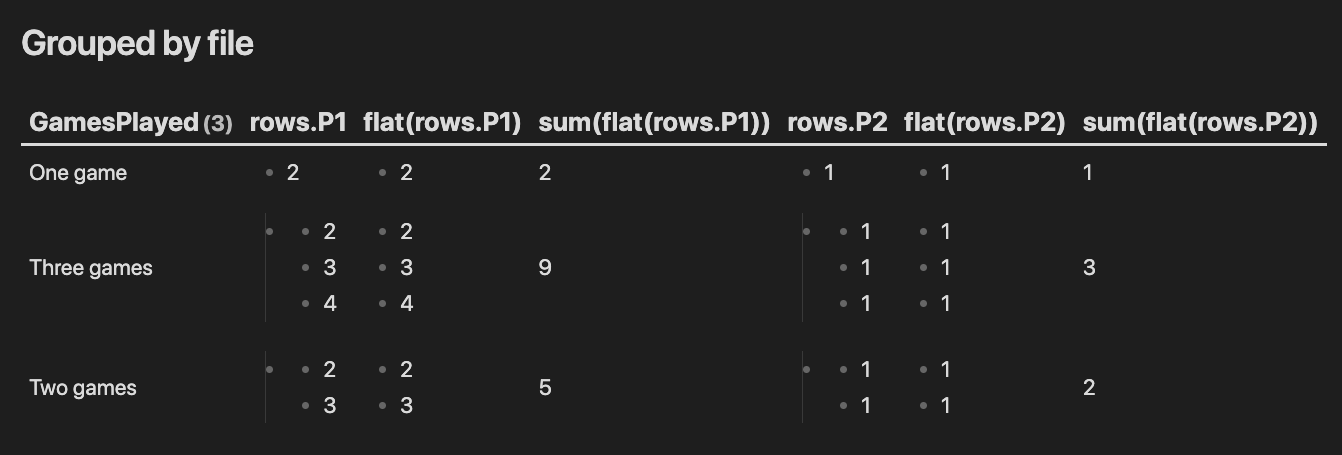
The next query shows some data when grouped by file (or day in your case):
The interesting thing to note here is that rows.P1 (and the same applies for P2, but I’m only going to talk about P1 from here on), is a multi-level list. I therefore use a new function of dataview (from v0.5.56) to flatten the list to one level, so that flat(rows.P1) is a conform one-level list. This allows for it to be summed nicely. (Doing sums(rows.P1) isn’t able to sum down through the levels)
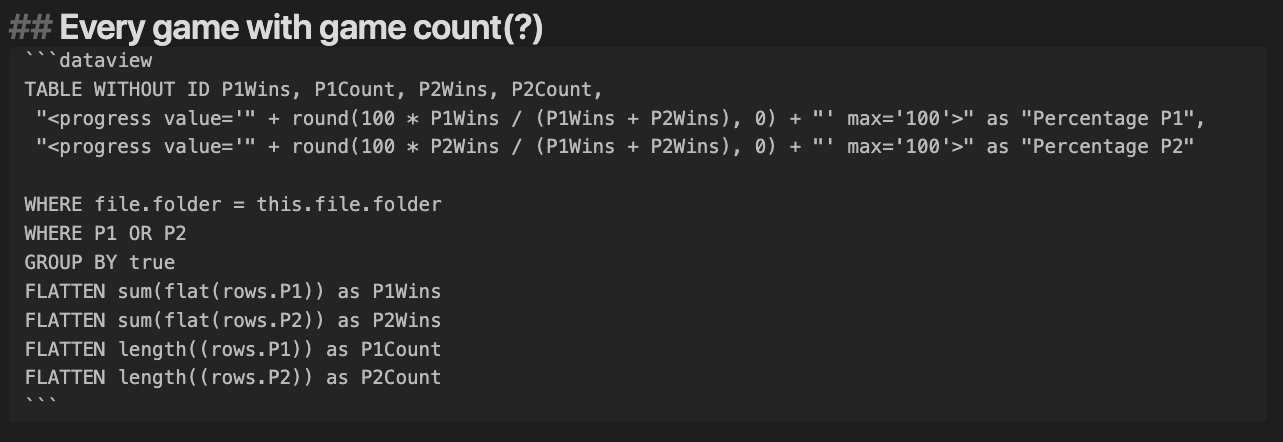
Then we continue to sum up all games in a slightly different matter, but the principle of using flat() albeit I now use GROUP BY true to sum every game. This results in:
Here I also added the progress bar just for the fun of it, to show the percentage of game wins for the player. Still not sure what the P1Count denotes, whether that is number of play sessions during that day, or what not. It’s there, and hopefully you can make sense out of that value (or just totally ignore it).
The last query does the “impossible” of adding a row to the query to get the totals in a separate row. This displays as:
Either of these last queries could be grouped by either file.name, file.link or true and get similar results, just with different groupings. The trick to this last query is that I’ve beforehand have made sure that the query within the dataviewjs query is producing the wanted resulted (except for the total), and then I use a second loop on this result set to build up the values used for the total row, which is then added at the end before presented to the end user.
Please do ask, if there is something unclear in either query. If needed, one could also add some extra styling to the last line, either through the highlight() function, or also through some extra magic using CSS.