What I’m trying to do
I’m trying to create a PIE chart of the time that I have spent in my entire day.
I’m currently using “Full Calendar” plugin to keep track of time and allocate the time against my events/tasks in the day (below is an example). Then I want to use this data to display a PIE chart of how my day has been.
Example data:
Events
- #sleep - [startTime:: 06:00] [endTime:: 10:00]
- #gettingReady for work - [startTime:: 10:00] [endTime:: 10:30]
- #commute to work - [startTime:: 10:30] [endTime:: 11:00]
- #meeting - [startTime:: 11:00] [endTime:: 11:30]
- #task1 - [startTime:: 11:30] [endTime:: 13:00]
- #lunch - [startTime:: 13:00] [endTime:: 14:00]
…
…- #sleep - [startTime:: 21:30] [endTime:: 00:00] [endDate:: 2023-02-13]
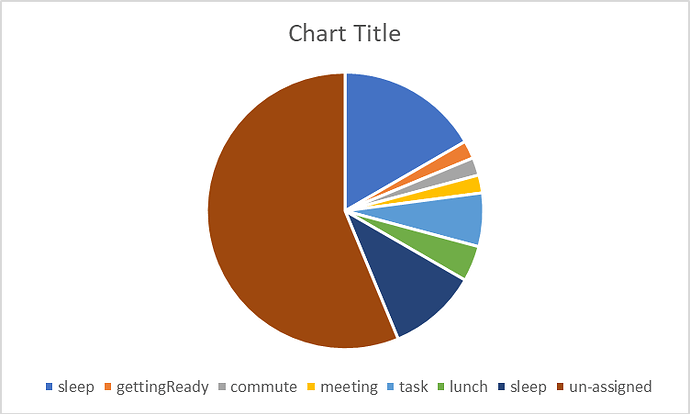
I would like to use the above data to generate a chart like below:
What have I tried
TBH, I’m stuck with how to approach this. I have tried below code without success
searchType: dvField
searchTarget: startTime, endTime
startDate: 2023-02-06
endDate: 2023-02-15
folder: Journal
valueShift: -24:00, 00:00
datasetName: Start, End

pie:
    title: Time Track
    data: 'dataset(0) - dataset(1)'
    dataColor: '#4daf4a,#377eb8'
    label: Start ,End
    ratioInnerRadius: 0.3
