Hi there! I’ve been trying to figure this out for a while and am hoping to not get into javascript to achieve what I’m trying to do. I’m hoping the community can help.
What I’m trying to do
I have notes from various activities that contain the duration of the activity, the classification of the activity (value flow), and the date of the activity.
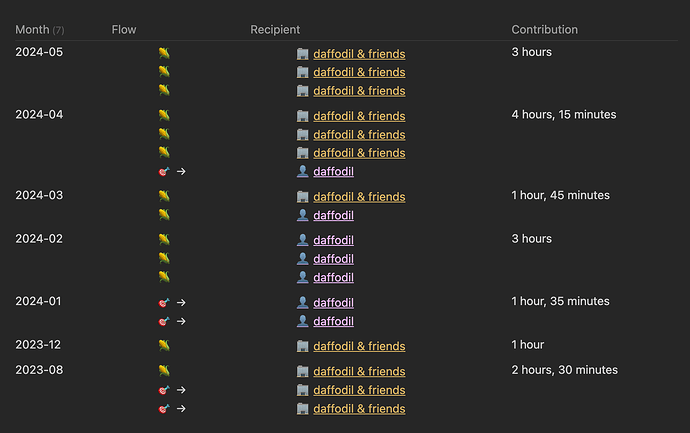
I’m trying to display the combined duration for activities, broken out their classification, grouped by the year and month. This is how far I can get currently. It’s nearly there!
As you can see, I get the total contribution for the month, but it lists out each classification. I would like to see the total for ![]() , then total for
, then total for ![]() →. So, under 2024-05, I would see a single
→. So, under 2024-05, I would see a single ![]() , then the total. Sort of like this:
, then the total. Sort of like this:
Things I have tried
I’ve read the docs and many posts, increased my general knowledge to a place where I feel really comfortable about doing each part (calculating and grouping), but I can’t quite find a way to do both.
I’m not a programmer/developer, so I’m trying to to keep things light by running DQL while still understanding what I’m doing. Is it possible to do this with just DQL?
Here is my query:
TABLE rows.value-flow AS Flow, rows.value-recipient AS Recipient, sum(rows.duration) AS Contribution
FROM ("10 Every Day/20 Meetings") OR ("10 Every Day/25 Actions")
WHERE contains(value-project, [[]])
GROUP BY dateformat(date,"yyyy-MM") AS Month
SORT Month DESC
Any help would be greatly appreciated!


