Using a Daily Note to log task and project work and calculate summaries

Hi all,

What I’m trying to do

My goal is to use my Obsidian Daily Note to track what I do throughout the day, and have some kind of calculation happen in that note that calculates totals for that day. I want to be able to add start times and end times on a single line along with other information like a project name and area of focus (I’m using the PARA method) under a headline like # Daily Log and then in another heading calculate the totals.

I’m basically trying to replicate a Toggl Track daily summary report in my daily Obsidian note. I’m even using the Toggl Track export as a starting point. Here’s an example of what some of the input lines would look like:
12:08:29 15:38:37 Processed boxes [[:construction: Project (2022-2023)]] [[:mountain: Development]]
15:55:59 15:57:26 Emailed Newsletter [[:construction: Historical Society History]] [[:mountain: Archive]]

And I’d want the output to have something like:
Project Work:

  • [[:construction: Project (2022-2023)]]: 3:30:08
  • [[:construction: Historical Society History]]: 0:01:27

Finally, I’d want that data to be displayed in the project note file as a dataview or tracker, along with Weekly, and Monthy notes.

Things I have tried

From what I’ve read, one solution seems to be with dataview or dataviewjs and using some kind of inline query but because I’m not a great coder and I’m not finding specific examples that relate to my problem, I’m struggling to adapt what is out there.
This page looks like it would be a solution for calculating project totals but in trying to parse the code, it’s pulling from already calculated totals from inline metadata like working hours:: 03:38, 02:42, 02:24, 05:46, 01:56
It also expects only a single working hours::

AlanG seems to have somewhat of what I’m looking for, and it looks great, but it doesn’t then group things into projects and just does a summary of a single day.

I did see that there’s a Toggl tracker plugin for Obsidian which was really promising, but I got an error that listed all my projects as “No Project” which is an error that has been described here for a while now.

I’d also rather have that data live in my vault rather than utilizing an API that Toggl might take away in the future.

I’d love to be able to display the data visually like Toggl does using something like Obsidian Charts but one step at a time, I guess.

Am I just overthinking this and there’s a simple solution out there that I’m just missing? I’d really love the community’s feedback and appreciate any help I can get.

Thanks in advance,

Dataview should make this easy without JS. Dates/times can be subtracted to get “Work hours”. You can use Group By with the sum function. Data Commands - Dataview
to get a total.
I haven’t actually tried it but it should work.

1 Like

Thanks for the comment. I tried looking through dataview a bit more and I’m not seeing how it could parse the data from a single line and then perform calculations. Have you run into any projects where there’ve been multiple list or paragraph items and dataview can group only specific parts of the line? Would that be like a regex function but then combined with the date function so it knows what is being calculated?

Here’s an example.

To do what you want, you need to convert your entries into a task first (- [ ] content). Then convert your entries to use inline metadata (- [ ] [start::(start)] [end::(end)] [description::(description)] [project::(project)] [area::(area)]). Lastly, you can access the entries using file.tasks in Dataview, like in the example.

daily log.md (1.1 KB)

1 Like

First of all if you have them as just lines, you’ll have to process the content of the entire file, so I would strongly suggest to go for a list/task style for recording these values. This will allow for dataview to pick up the lines a lot easier:

- [a] 12:08:29 15:38:37 Processed boxes [[:construction: Project (2022-2023)]] [[:mountain: Development]]
- [a] 15:55:59 15:57:26 Emailed Newsletter [[:construction: Historical Society History]] [[:mountain: Archive]]

Here I’ve used a decorated task, and in my test vault the [a]-tasks shows as:

This allows for using TASK queries from dataview to query the information. Before going there, I would also point out that just a timestamp isn’t recognised by Dataview as a proper date, since the date part is missing. So one trick related to that is to prepend any date to the front of the timestamp to make it into a proper date, which can then be used for duration calculations.

Another caveat related to Dataview is that it’s not a problem to use a query within your daily note to produce the time spent on any given project. However, to re-use the result value from that query another place isn’t as easy. In fact, it’s easier to just reproduce the query in that other place. In other words, use the same query in both the daily note and the weekly/monthly/project note, and just vary the limitations of the query related to where it picks it values from.

So with this being said here is the link to two of my earlier responses related to similar cases, which hopefully you can utilise to build a query for your need:

For a purer solution using only dataviewjs, see the next thread response by AlanG:

In your example you’re using :construction: to get that emoji, that’s a no-go for file name. You need to use the true emoji character, aka 🚧 (and ⛰️), for the filename to be legal.

With that correction, try out the following queries:

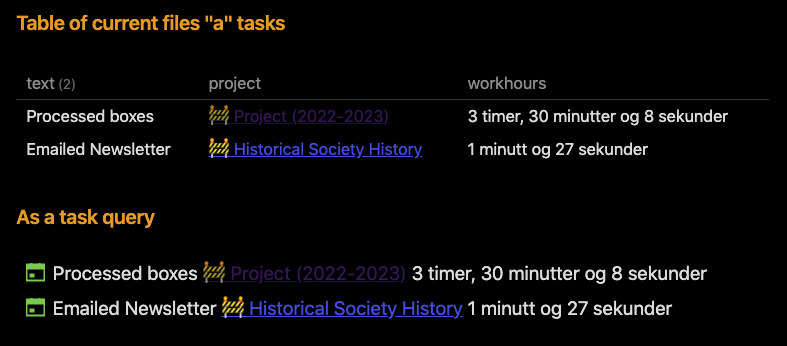
## Table of current files "a" tasks

```dataview
TABLE WITHOUT ID text, project, workhours
FLATTEN file.tasks as task
FLATTEN array(split(task.text, " ", 2)) as time
FLATTEN regexreplace(substring(task.text, 18), " *\[\[🚧.*$", "") as text 
FLATTEN filter(task.outlinks, (l) => startswith(meta(l).display, "🚧")) as project
FLATTEN (date("2023-06-02T" + time[1]) - date("2023-06-02T" + time[0])) as workhours
WHERE file.path = this.file.path
WHERE task.status = "a"
  AND regextest("\d{2}:\d{2}:\d{2}", time[0])
  AND regextest("\d{2}:\d{2}:\d{2}", time[1])
```

## As a task query

```dataview
TASK
FLATTEN array(split(text, " ", 2)) as time
FLATTEN regexreplace(substring(text, 18), " *\[\[🚧.*$", "") as text 
FLATTEN filter(outlinks, (l) => startswith(meta(l).display, "🚧")) as project
FLATTEN (date("2023-06-02T" + time[1]) - date("2023-06-02T" + time[0])) as workhours
FLATTEN text + " " + project + " " + workhours as visual
WHERE file.path = this.file.path
WHERE status = "a"
  AND regextest("\d{2}:\d{2}:\d{2}", time[0])
  AND regextest("\d{2}:\d{2}:\d{2}", time[1])
```

Given the usage of proper emojis, this should produce something like the following in your own locale:

These queries uses a multitude of various tricks to pull out the wanted data, and there is little to none error checking, so if you leave out or misformat the times it’ll fail. If you don’t have the project first, it’ll fail, and so on. It’s more a proof of concept, than anything else.

An attempt at explaining the query
  • FLATTEN file.tasks as task – Within the TABLE context we need to do this access each task as a separate task in the task variable
  • FLATTEN array(split(task.text, " ", 2)) as time – Using split(..., " ", ") the text in question is split on the space character, and we keep the two first entries. However, since we’re in a FLATTEN which loves to flatten arrays, we need to pack the entire thingy in array( ... ) to preserve these two values into the time variable. Now time[0] will hold the start time, and time[1] will hold the end time
  • FLATTEN regexreplace(substring(task.text, 18), " *\[\[🚧.*$", "") as text – In order to get the information in the task without the times and link, we skip the first 18 characters using substring( ... , 18), and then we use regexreplace() to get rid of the link starting with the project emoji, and until end of line. This could be done with a single regex, but I kind of like this alternative. The result is stored in text
  • FLATTEN filter(task.outlinks, (l) => startswith(meta(l).display, "🚧")) as project – In your example to focused on the project, so lets filter out only the outlinks of the tasks going to a link starting with the project emoji, and store this link as project
  • FLATTEN (date("2023-06-02T" + time[1]) - date("2023-06-02T" + time[0])) as workhours – Construct two proper dates and subtract them from each other. I’m using todays date as a “random” date to make the timestamps into dates, and then just subtract the dates from each other. This produces as duration. Note that these can be formatted, and manipulated further using sub-fields, and so on. Like you could do <duration>.hours to get the <duration> as pure hour output. (Other valid sub-fields are: years, quarters, months, weeks, days, hours, minutes, seconds, milliseconds)
  • WHERE file.path = this.file.path – This WHERE clause limits this query to only look in the current file. Can be removed for a query across your entire vault (and/or combined with a FROM clause (before any FLATTEN line) to limit where to look for tasks like these)
  • WHERE task.status = "a" AND regextest("\d{2}:\d{2}:\d{2}", time[0]) AND regextest("\d{2}:\d{2}:\d{2}", time[1]) – This WHERE clause verifies that we’re only looking at tasks of type [a], and that the two time parts are actually timestampts with hours, minutes and seconds
Even further details when transforming into a TASK query

The query is then repeated as a TASK query, and not just a TABLE query. To transform the query the following needs to be done:

  • No need to do the FLATTEN file.tasks as task since in that is implicit in this type of query
  • Due to the previous, remove all references to task.
  • You can’t have multiple columns within a task text, but you can redefine the task test and name it visual, and still maintain the task link to the original task text! I really like this hidden gem of the TASK queries!

The project query variants

When going to the project queries, you need to keep the basic structure of the queries with all the FLATTEN calculations, but you might want to add extra information like file.link to get the originating note (at least in the table variant). And you need to limit to only the current project. So one variant for the table query would then be:

```dataview
TABLE WITHOUT ID file.link as note, text, workhours
FLATTEN file.tasks as task
FLATTEN array(split(task.text, " ", 2)) as time
FLATTEN regexreplace(substring(task.text, 18), " *\[\[🚧.*$", "") as text 
FLATTEN filter(task.outlinks, (l) => startswith(meta(l).display, "🚧")) as project
FLATTEN (date("2023-06-02T" + time[1]) - date("2023-06-02T" + time[0])) as workhours
WHERE task.status = "a"
  AND regextest("\d{2}:\d{2}:\d{2}", time[0])
  AND regextest("\d{2}:\d{2}:\d{2}", time[1])
WHERE project = this.file.link
```

Note the changes on the top line, with the removal of project and addition of file.link as Note, and the change of the limiting WHERE clause to limit to this project. The query above, and the TASK variant below needs to be in the “home page” of that project to properly work.

As a TASK query
```dataview
TASK
FLATTEN array(split(text, " ", 2)) as time
FLATTEN regexreplace(substring(text, 18), " *\[\[🚧.*$", "") as text 
FLATTEN filter(outlinks, (l) => startswith(meta(l).display, "🚧")) as project
FLATTEN (date("2023-06-02T" + time[1]) - date("2023-06-02T" + time[0])) as workhours
FLATTEN text + ": " + workhours + " (" + file.link + ")" as visual
WHERE status = "a"
  AND regextest("\d{2}:\d{2}:\d{2}", time[0])
  AND regextest("\d{2}:\d{2}:\d{2}", time[1])
WHERE project = this.file.link
```

Same kind of changes, and here I’ve added the file.link to the end of the task text. Could’ve used GROUP BY file.name or similar, but my preference is this variant.

Calculation of project totals

If you in addition to the previous queries like to calculate the sum of how much time has been spent on the various projects, you could add the usage of sum() function in some combination of either GROUP BY true when dealing with a single project, or GROUP BY project if you want to list all the totals. Here is the variant for all sums:

```dataview
TABLE sum(rows.workhours) as total
FLATTEN file.tasks as task
FLATTEN array(split(task.text, " ", 2)) as time
FLATTEN regexreplace(substring(task.text, 18), " *\[\[🚧.*$", "") as text 
FLATTEN filter(task.outlinks, (l) => startswith(meta(l).display, "🚧")) as project
FLATTEN (date("2023-06-02T" + time[1]) - date("2023-06-02T" + time[0])) as workhours
WHERE task.status = "a"
  AND regextest("\d{2}:\d{2}:\d{2}", time[0])
  AND regextest("\d{2}:\d{2}:\d{2}", time[1])
GROUP BY project
```

Weekly/monthly variants

These queries, which I leave up to you to generate, are basically variant over the same template as given in the queries above. What you need to vary is the WHERE clauses to pick out a suitable data set, so that instead of a WHERE file.path = this.file.path you need to concoct something to limit your file set to the week/month of choice.

Summation and/or listing of the various tasks will be the same as before.

For details on how to create CSS to decorate the task like I’ve done see:

1 Like

Going this route of defining all the fields could be a better solution, as it would simplify the queries a lot. I would possibly consider using (field:: value) for some of the fields to hide the key from displaying. (This could also be done using CSS if you keep using the [field:: value] variant )

I’d still use a custom status, though, to help limit the queries.

And just for those not wanting to download that daily log.md file, here is the content:

## Data

- [ ] [start::15:55:59] - [[end::15:57:26]] [description::Emailed Newsletter] [project::[[🚧 Historical Society History]]] [area::[[⛰️ Archive]]]
- [ ] [start::16:00:29] - [end::17:15:00] [description::Processed boxes] [project::[[🚧 Project (2022-2023)]]] [area::[[⛰️ Development]]]
- [ ] [start::19:00:29] - [end::23:15:00] [description::Processed boxes] [project::[[🚧 Project (2022-2023)]]] [area::[[⛰️ Development]]]

## Views

~~~dataview
table without id
	date("1970-01-01T" + task.end) - date("1970-01-01T" + task.start) as "Duration",
	task.start as "Start",
	task.end as "End",
	task.description as "Description",
	task.project as "Project",
	task.area as "Area"
where file = this.file
flatten file.tasks as task
~~~

~~~dataview
table without id
	project as "Project",
	sum(map(rows.task, (task) => date("1970-01-01T" + task.end) - date("1970-01-01T" + task.start))) as "Duration"
where file = this.file
flatten file.tasks as task
group by task.project as project
~~~

Total duration: `=sum(map(this.file.tasks, (task) => date("1970-01-01T" + task.end) - date("1970-01-01T" + task.start)))`

This can easily be adjusted to limit to tasks of a given status, if one want to do so. But as can be seen, the queries are a lot easier when we don’t need to “extract” the various information, as they’re already stored in proper fields. However, this also comes with the extra “clutter” of those field definition markup.

Also note that one could do link(task.project) to get the link to the project (and similar for the area).

Thanks so much, @holroy and @polyipseity for your help. I ended up implementing @polyipseity’s model and it works great in the daily note. The “Weekly/monthly variants” section you mentioned is where I’m running into problems. I’ve been getting a lot of help from user “quote” on the Obsidian Discord, but I’ve hit a wall as the suggestions are yielding no results.
My vault’s structure is to have all of these tasks located in my daily notes, whereas my various project notes are in different folders. Whether there are some variant of periodic notes (weekly, monthly, quarterly, yearly) or a project note, I would like to see a summary appropriate to the setting.

“quote”'s suggestion on Discord was to swap out the where clause and use the task.project and look for the link using the link function. This is what I have below that I’ve placed in my project file named":construction: Historical Society History" but it doesn’t yield any results.

Project Tasks

table without id
	date("1970-01-01T" + task.end) - date("1970-01-01T" + task.start) as "Duration",
	task.start as "Start",
	task.end as "End",
	task.description as "Description",
	task.project as "Project",
	task.area as "Area",
	task.output as "Link"
where task.project = link("🚧 Historical Society History")
flatten file.tasks as task

I’m similarly stuck with the total calculation for the project and am unsure how to transform this.file.tasks while this code is living in the project file.

Total Project Duration

=sum(map(this.file.tasks, (task) => date("1970-01-01T" + task.end) - date("1970-01-01T" + task.start)))

I’m assuming that once I can get this working, I’d be able to get any variations to work for my other periodic notes or other specific project notes.

I appreciate your thoughts and really big thank you for the careful explanation. It’s helping me better understand the code, although not yet to the level that I’m able to solve this problem.

Ok, happy to report I’ve been able to get the dataview query working for links outside of the file. I’m posting here in case it might be helpful.
Dataview query for Project Note files that pulls from my daily notes and calculates how much time is spent on a project by task rows:

TABLE
	date("1970-01-01T" + task.end) - date("1970-01-01T" + task.start) as "Duration",
	task.description as "Description",
	task.area as "Area",
	task.output as "Link"    
from #dailyNote 
flatten file.tasks as task 
where task.project = [[🚧 Historical Society History]]

This dataview adds up all the time spent on the project:

table without id
	project as "Project",
	sum(map(rows.task, (task) => date("1970-01-01T" + task.end) - date("1970-01-01T" + task.start))) as "Duration"
from #dailyNote 
flatten file.tasks as task
where task.project = [[🚧 Historical Society History]]
group by task.project as project

It’s been really helpful for me to document and track my work, and it’s nice to be able to do it in a single app rather than toggl. I can’t say the logging portion in the daily log is very pretty, but since I have some control of the summary queries, it’s not terrible. I have an espanso trigger that puts out the following code as a task whenever I finish something.

[start::] - [end::] - [description::] - [project::[[:construction: ]]] - [area::[[:mountain: ]]] - [output::]

I’m eager to see if I can incorporate Obsidian Charts into all this for visuals.

Thanks again to holroy, polyipseity and “quote” on Discord for the help.

This topic was automatically closed 7 days after the last reply. New replies are no longer allowed.