In a thread discussing ideas for a future graphical timeline plugin, I was asked if I could share the event-based timeline setup I use for historic research and writing. The following is obviously a work in progress and I add stuff whenever it is needed, but so far it has proved to be very useful. It lacks graphical spans or period lines, but it does what I need it to do. It has the advantage of using only the Dataview plugin which, imho, could be the basis for any future timeline plugin since it would dispense users from learning yet another markup syntax.
Please note that I am not a professional developer and that a lot of this stuff could probably be done better, refined and developed further still.
Events
All events are just files inside a folder called events. I have a template which adds the following to each new event created:
---
tags: event
date:
---
I use the event tag as well so that I can easily make other notes into events later on, without moving them from where they are. I then enter the date in the appropriate field.
Having each event as an individual note allows mixing events which are just dates with nothing but a note title with full-blown documents which include text, links or any other content.
Date format
In the Dataview preferences I use yyyy-MM-dd. This has the benefit of allowing me to use year-only and month-only dates (e.g. 2023 or 2023-05) when I need them.
However, they have to be entered in a special format because Dataview will not detect strings formatted as yyyy-MM as a valid date, or will do some implicit conversions which I don’t need (such as converting 2023-05 to 2023-05-01). So a year is entered as 2023 -- -- and a month as 2023-05 --. This also stands out nicely in the final output and suits me fine. In an earlier project, before using Obsidian, I was used to entering 2023-05-00 when the day was not important but Dataview doesn’t enjoy that and adapting isn’t a big deal.
Category tags
In order to view at a glance major event categories I add them in the events that need them. For example, this file is named “Birth of Richard Nixon”, and “nixon” is an important category of the timeline, so it gets tagged.
---
tags: event, nixon
date: 1913-01-09
---
If an event is a major world event I use this:
---
tags: event, historic
date: 1945-07-17
---
Births and deaths
I enter births and dates of relevant people as separate events, carefully titling name "Birth of " and "Death of ", as this allows some fun stuff later on.
Displaying the timeline
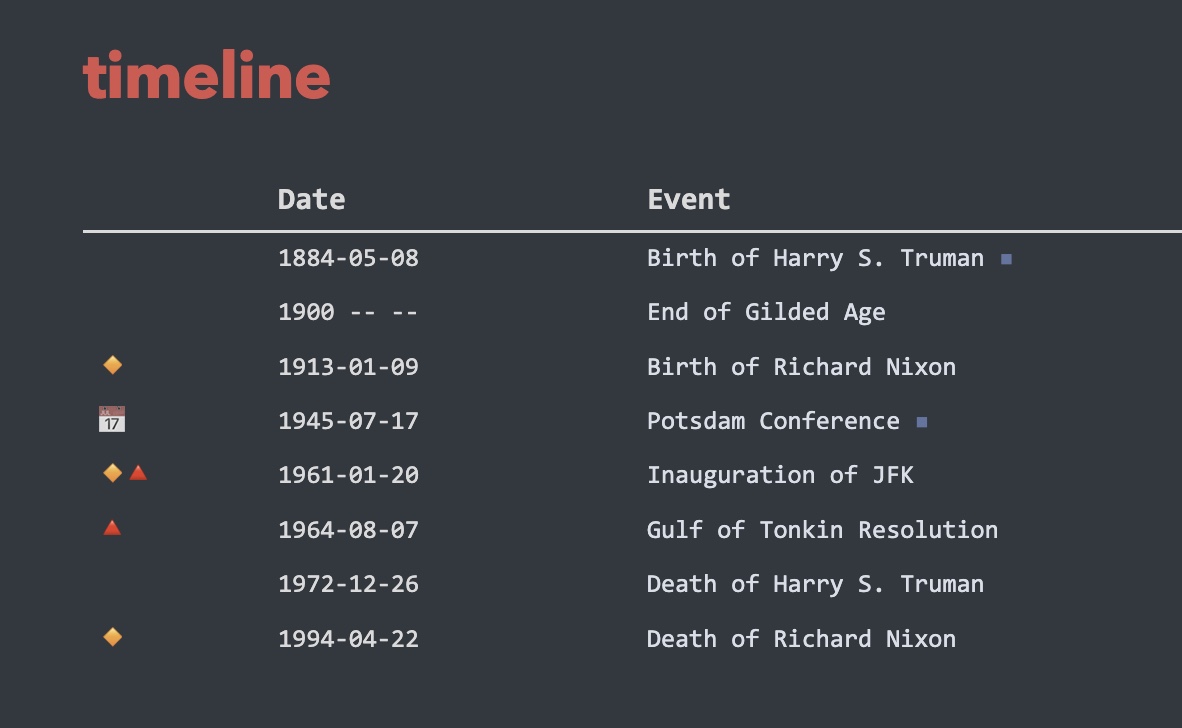
The timeline is displayed in a separate note using Dataview, using TABLE WITHOUT ID to show the date before the event title:
TABLE WITHOUT ID
	choice(contains(tags, "historic"), "📅", "") +
	choice(contains(tags, "nixon"), "🔸", "") +
	choice(contains(tags, "johnson"), "🔺", "")
	AS "",
	date AS "Date",
	choice(file.size > 60, "<span class=\"more-text\">" +
    file.link +
    "</span>", file.link) AS "Event"
FROM
	#event AND !"_templates"
SORT
	string(date) ASC
I am sorting by string(date) so that year-only and month-only dates appear where they should.
This adds:
- Fancy icons which aid readability.
- A small icon next to the event text to indicate that an event has more content in the note itself (60-byte file size works in most cases but may miss some, it’s not hugely important).
CSS
I use a monospaced font so that the dates align nicely. AFAIK Dataview can’t include separate CSS styles for separate columns but it’s not a big deal.
.table-view-table a {
	border: none;
}

.table-view-table {
	font-size: 0.8em;
	font-family: var(--font-mono);
}

.table-view-table .more-text a:after {
	content: ' ▪';
	color: var(--color-6);
}
Result
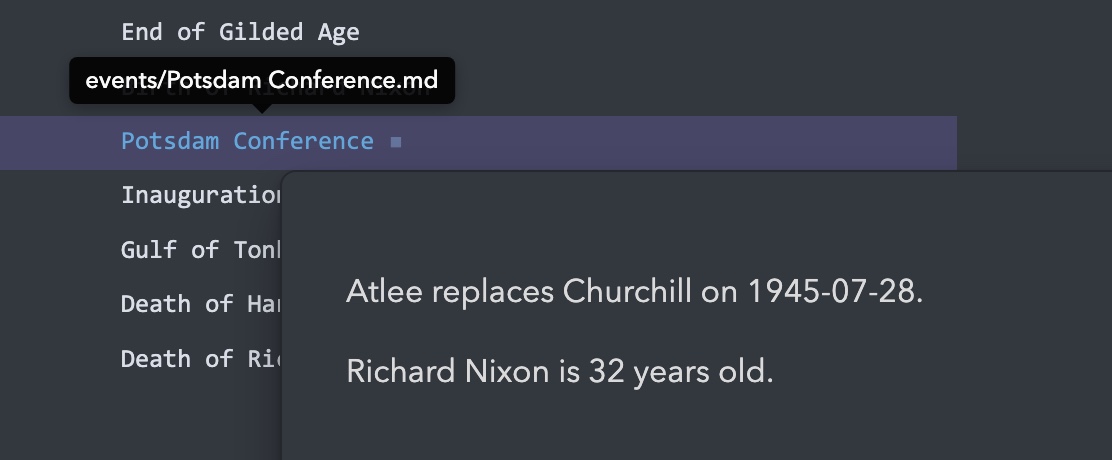
The result is the screenshot at the top of this post. When hovering over a date with a “more text” symbol, more details of the event are shown.
Filtering
The timeline query can be filtered to show only certain date spans but dates have to be converted to strings for the reason described above (when sorting):
WHERE
	string(date) < "1960"
It is also trivial to include, e.g. in a note dedicated to a certain person, the events relevant to that person (or at least those mentioning that person in the event title):
TABLE WITHOUT ID
date AS Date,
file.link AS Event
FROM #event
WHERE contains(file.name, "Nixon")
SORT string(date) ASC
Fun stuff
As usual, this setup can be extended to do all sorts of things with varying degrees of usefulness. The following example use dataviewjs.
Create a template that takes a person’s name and displays the age that person had at the event where it is inserted (as above, for Nixon at the Potsdam Conference):
const person = "Richard Nixon";
const age = parseInt(String(dv.current().date).substring(0, 4)) - parseInt(String(dv.page("Birth of " + person).date).substring(0, 4));
dv.paragraph(person + " is " + age + " years old.");
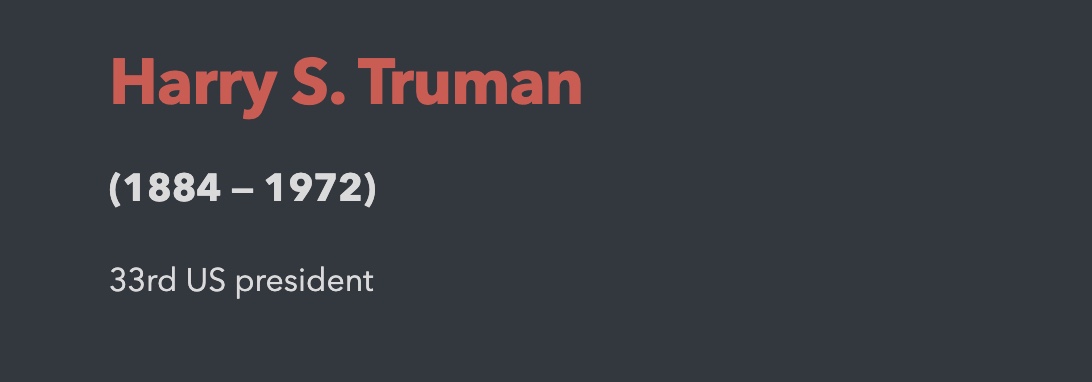
Create a template which inserts a person’s birth year and death year on that person’s page with some custom CSS:
dv.el("p",
	"(" +
	String(dv.page("Birth of " +
	dv.current().file.name).date).substring(0, 4) +
	" — " +
	String(dv.page("Death of " +
	dv.current().file.name).date).substring(0, 4) + ")",
	{ cls: "born-died" }
	)
Which gives this:
All this can be extended in a gazillion directions but for the time being I’m pretty happy with it and it’s fast enough for my needs (I have 300 around dates and it’s pretty snappy both on macOS and on a very old iPhone). It’s not Aeon Timeline, but it’s getting close and it’s completely integrated into my writing environment.
Conversion
In case it helps anyone : before moving to Obsidian I had already created a large list of dates in a Google sheet, and it was a major bother to have just this chunk of info outside of my note-taking environment.
In Sheets, events were categorized by columns for visual separation. General dates were in Column A (date) and Column B (event name), events pertaining to some specific category in columns C & D, etc. Since I didn’t feel like manually creating, copying and pasting 300 markdown files, I made this quick Python script that did the job quickly, including tagging and converting my year-only and month-only dates to the format described above.
# Convert timeline originating from spreadsheet to Obsidian notes

import csv

FILENAME = 'chrono.csv'

# read csv
with open(FILENAME, newline='') as csvfile:
    data = list(csv.reader(csvfile))

notes = []

# Spreadsheet notes are categorized by column
tags = {
    0: "",
    2: "nixon",
    4: "johnson",
    6: "italy"
}

# Convert CSV timeline to list of dicts
for row in range(0, len(data)):
    for n in range(0, len(data[row]), 2):
        if data[row][n] != '':
            date = data[row][n]
            if len(date) == 4:
                date += ' --'
            if len(date) == 7:
                date += ' --'
            title = data[row][n+1]
            title = title.replace(':', '--')
            tag = tags[n]
            notes.append(
                {
                    "title": title,
                    "tag": tag,
                    "date": date
                }
            )
            break

# Create a Markdown file for each entry
for note in notes:
    f = open(note['title'] + '.md', 'x')
    f.write('---\n')
    tag = note['tag']
    if tag != '':
        tag = ', ' + tag
    f.write('tags: event' + tag + '\n')
    f.write('date: ' + note['date'] + '\n')
    f.write('---\n')
    f.close