Trouble charting .csv file using dataviewjs and obsidian-chart

What I’m trying to do

hi, I am trying to plot my sleep.csv file with obsidian chart, but I can’t read the data properly. This is what the file looks like:

Date,Hours
2023/3/26,7
2023/3/27,7
2023/3/28,9
2023/3/29,9
2023/3/30,6
2023/3/31,10
2023/4/1,8
2023/4/2,10
2023/4/3,10
2023/4/4,9
2023/4/5,8
2023/4/6,8
2023/4/7,12
2023/4/8,7
2023/4/9,7
2023/4/10,0
2023/4/11,7

Things I have tried

According to dataview docs, loading a csv file returns a dataview array like this

await dv.io.csv(“hello.csv”) => [{ column1: …, column2: …}, …]

Therefore when I attempt to plot it with obsidian-charts

```dataviewjs
const data = await dv.io.csv("Sleep.csv");
dv.paragraph(`\`\`\`chart 
	type: bar 
	labels: [${data.Date}] 
	series: 
	- title: Hours 
	  data: [${data.Hours}] 
\`\`\``) 
```

It looks like this

Appreciate help on how to get data from each column properly.

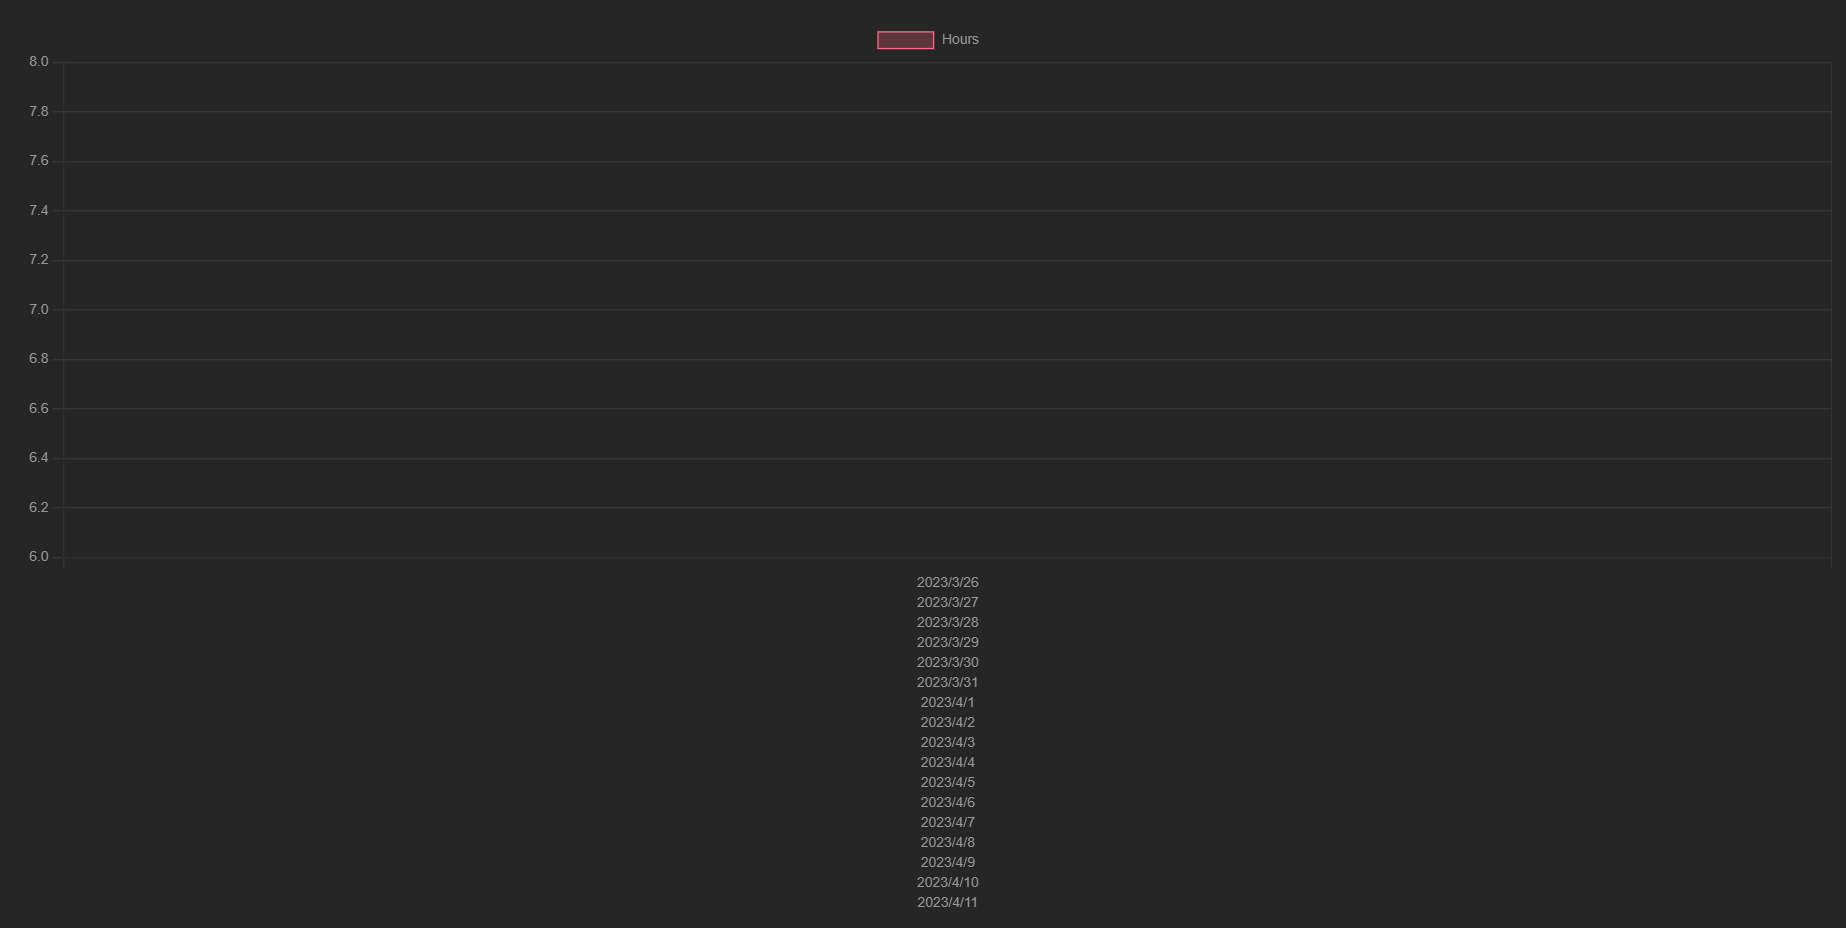
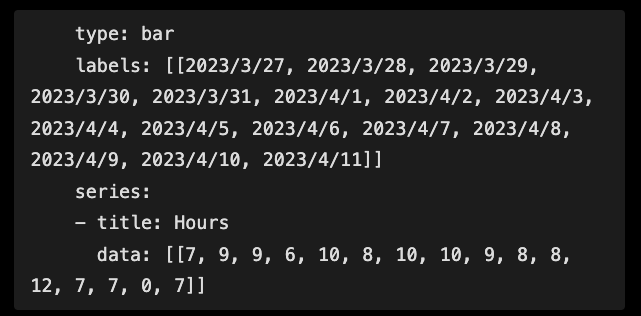
Using some variant over the theme debug output, is usually very useful. In your case I simply removed the chart text to render the entire output as a code block. This resulted in the following output:

image

And here one can see that issue is simply that you’ve made an array of arrays with just one element. You shouldn’t use [${ data.Date }], but just ${ data.Date }.

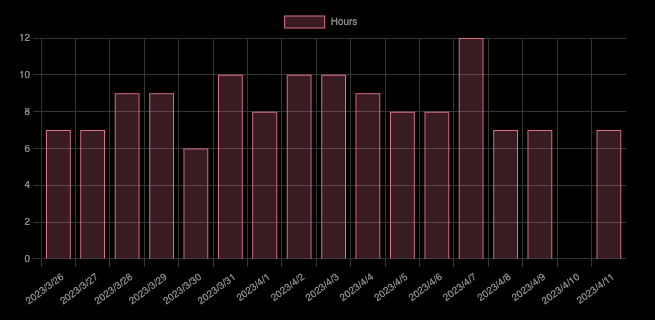
Doing this, and changing the code block fence to using tildes instead of backticks, which makes it a whole lot easier to handle in javascript, your query now looks like:

```dataviewjs
const data = await dv.io.csv("Sleep.csv")

dv.paragraph(`~~~chart 
	type: bar 
	labels: ${data.Date} 
	series: 
	- title: Hours 
	  data: ${data.Hours}
~~~`) 
```

And the output is:
image

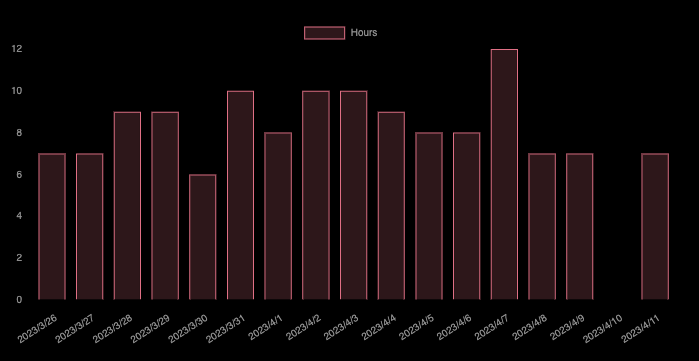
Another version accomplishing almost the same chart, but which I think opens up even more possibilities is this version doing most of the work within dataviewjs.

```dataviewjs

const data = await dv.io.csv("Sleep.csv")

// const myDates = data.map(d => d.Date).values
// const myHours = data.map(d => d.Hours).values

const chartData = {
  type: 'bar',
  data: {
    labels: data.Date.values, // or myDates
    datasets: [{
      label: 'Hours',
      data: data.Hours.values, // or myHours
      backgroundColor: [
        'rgba(255, 99, 132, 0.2)'
      ],
      borderColor: [
        'rgba(255, 99, 132, 1)'
      ],
      borderWidth: 1
    }]
  }
}
window.renderChart(chartData, this.container)
```

The output:

This topic was automatically closed 90 days after the last reply. New replies are no longer allowed.