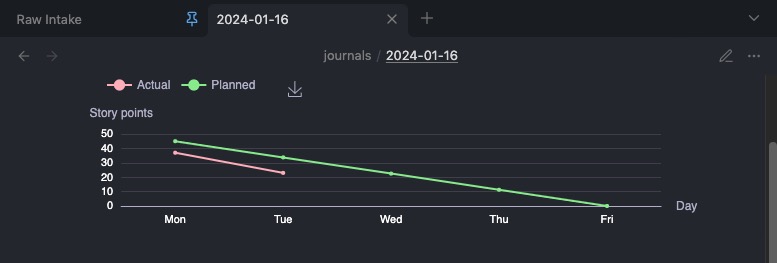
This is what I came up with to get a burn down chart of my tasks for the current week
Required plugins:
- Dataview
- Periodic notes
- Tasks
- Obsidian echarts
Your daily notes must be named in format YYYY-MM-DD
// this creates a burn down chart for the current week for tasks scheduled within the week
// this creates an array with the dates from the current week
let week = Array.from(Array(7).keys()).map((idx) => {const d = new Date();
d.setDate(d.getDate() - d.getDay() + idx);
return d.toLocaleString("en-CA").substr(0,10);
});
// ++++++ BUILD THE SERIES TO PLOT THE "PLANNED" STRAIGHT LINE
// array that will contain the total of story points for each story size
let totalplannedSS = []
// create an array with counts of each story sizes SnS quantities
// the sum of array values will give us the total number of points
let storysizes = [1, 2, 3, 5, 8, 13, 21]
// Story sizes here are set to Fibonacci values but you may use a different set of numbers
// The only important thing is that your task is properly tagged
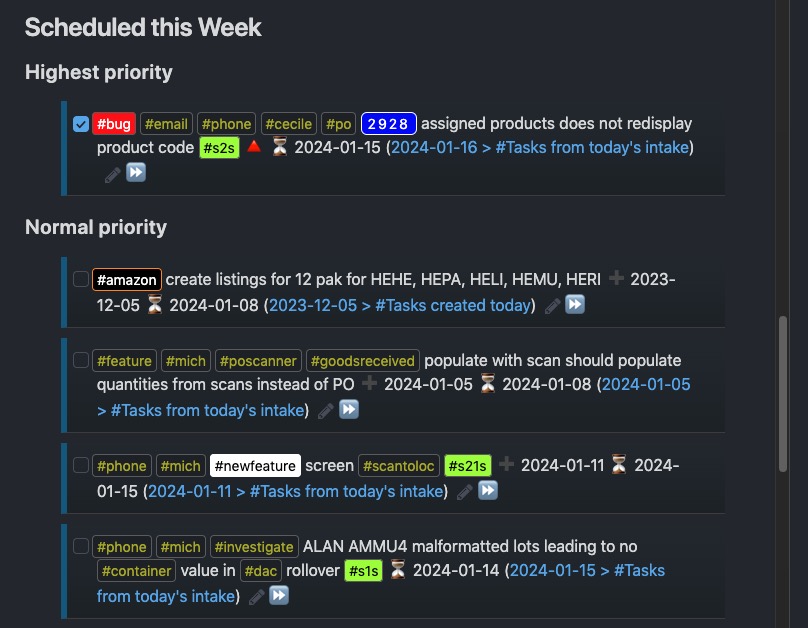
// You must use the format #s{storysize}s , that is one lower case s, story size, lower case s (example #s3s for 3 points)
// This must be in the task text, before the dates in order to be correctly calculated
for (let j = 1; j <= storysizes[storysizes.length -1]; j++) {
// counts the number of tasks for each story size for all stories scheduled this week
// adjust your folder names to retrieve FROM te folders you want to be queried
if(storysizes.includes(j)){
let storyCount = j * ((await dv.tryQuery('TASK FROM "journals" OR "meetings" WHERE scheduled >= date("'+week[1]+'") AND scheduled < date("'+week[5]+'") AND contains(text,"#s'+ j + 's")')).values.length)
totalplannedSS.push(storyCount)
}
}
// then we sum the array to get the total number of story points for the week
// and we get each day's value for the regression in order to get the PLANNED series
let totalstorypoints = (totalplannedSS.reduce((a, b) => a + b, 0))
let planned = [totalstorypoints]
let tuesdaystorypoints = totalstorypoints - (totalstorypoints/4)
let wednesdaystorypoints = tuesdaystorypoints - (totalstorypoints/4)
let thursdaystorypoints = wednesdaystorypoints - (totalstorypoints/4)
planned.push(tuesdaystorypoints)
planned.push(wednesdaystorypoints)
planned.push(thursdaystorypoints)
planned.push(0)
// ++++++ EOF BUILDS THE SERIES TO PLOT THE PLANNED "PLANNED"
// ++++++ BUILD THE SERIES TO PLOT THE "ACTUAL" LINE
// the process for the ACTUAL series is similar as above, with the difference of the count queriying the completed that day for each day
// then we deduct each completed that day from the previous actual
let completed = []
let actual = totalstorypoints
for (let i = 1; i < week.length; i++) {
let completedthisday = []
for (let j = 1; j <= storysizes[storysizes.length -1]; j++) {
if(storysizes.includes(j)){ // if we are within a story size
let completedCount = j * ((await dv.tryQuery('TASK FROM "journals" OR "meetings" WHERE scheduled >= date("'+week[1]+'") AND scheduled < date("'+week[5]+'") AND completion = date(' + week[i] + ') AND contains(text,"#s'+j+'s")')).values.length)
completedthisday.push(completedCount)
} // eof if we are within a story size
} // eof sum
// summarize story sizes for the day
let totalcompletedthisday = (completedthisday.reduce((a, b) => a + b, 0))
// decrease the actual by the completed this day
actual -= totalcompletedthisday
// we do not want to plot in te future, a dash will tell echart no to plot
if(week[i] > (dv.luxon.DateTime.now().toFormat('yyyy-MM-dd')) ) {
actual = '-'
}
completed.push(actual)
//console.log(actual)
}
let daysLabels = ['Mon','Tue','Wed','Thu','Fri']
// ++++++ EOF BUILD THE SERIES TO PLOT THE "ACTUAL" LINE
// ++++++ ECHART CODE USING THE SERIES +++++++++++++
const option = {
width: 700,
height: 150,
backgroundColor: 'transparent',
grid: {
bottom: -1,
containLabel: true
},
title: {
text: ''
},
toolbox: {
left: 250,
feature: {
saveAsImage: {}
}
},
tooltip: {trigger: 'axis'},
legend: {left: 70},
xAxis: {
type: 'category',
name: 'Day',
axisTick:{length: 0.06},
axisLabel: {rotate: 0,interval: 0, textStyle: {fontSize: "11",color: "#fff"}, height: 100},
data: daysLabels
},
yAxis: {name: "Story points",
axisLabel: {textStyle: {fontSize: "11",color: "#fff"}}
},
series: [
{
type: "line",
name: "Actual",
color: 'lightpink',
data: completed
},
{
type: "line",
color: 'lightgreen',
name: "Planned",
data: planned
}]
}
app.plugins.plugins['obsidian-echarts'].render(option, this.container)
Let me know what you think
New ideas welcome!