As a graduate student, my academic objective is to engage in research utilizing quantitative methodologies. Initially, I considered using Canvas for designing and structuring my research model. However, I discovered that it lacks the necessary feature to support entity-pointer arrow lines, which are crucial for illustrating relationships and processes in my research model. Therefore, I hope you’ll consider it in your next development updates.
1 Like
Maybe I don’t fully understand, but does this necessarily have to be done with Obsidian itself? Have you considered a plugin like Obsidian Graphviz or using Mermaid or another text-based graphing tool?
If those don’t fit (i.e., if its relationships between notes shown in Graph View that you’re talking about); could you elaborate and explain more about what you’re asking for? How would you imagine those relationships between notes being configured?
My thoughts are as shown in the diagram below.
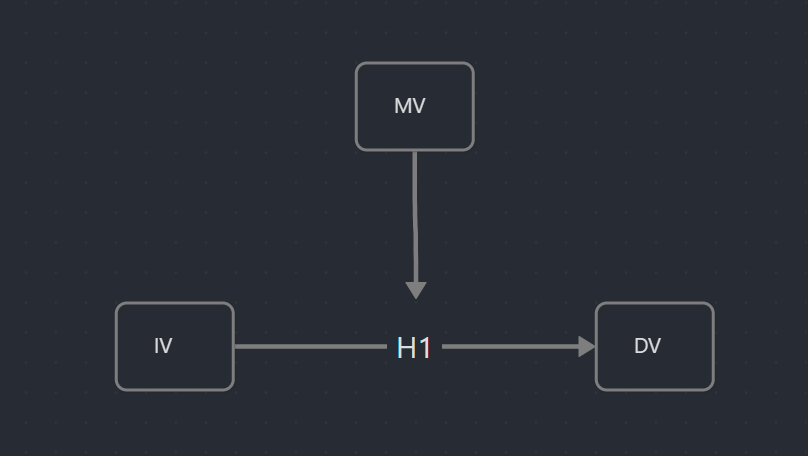
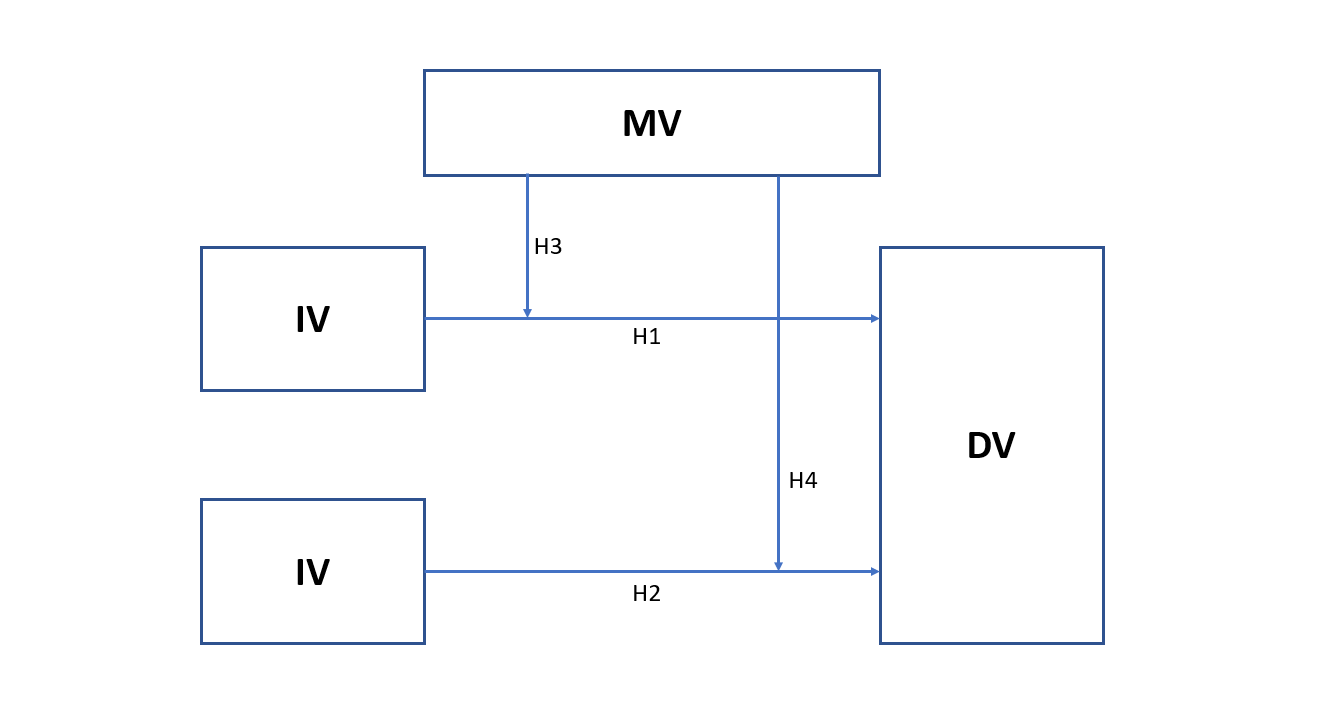
I would like the entity to be able to point to lines to show the position of moderators in the quantitative research model, however, Obsidian Canvas or mermaid do not support this kind of functionality. As for Obsidian Graphviz, I am not used to using it myself, so I hope Obsidian Canvas could support this kind of functionality.