G’day first post so hopefully ends up in the right catagory/ place
What I’m trying to do
I am experimenting with the tasty obsidian-tracker plugin by @pyrochlore (thanks). What I am trying to do is as follows.
Draw a bar graph (one bar per week) that sums up the number of times a note occurs.
If any body knows how to achieve this with Tracker or Dataview I t will be a great help.
Things I have tried
``tracker
searchType: tag
searchTarget: 🏋️♀️
datasetName: WorkoutCounts
dateFormatPrefix: RTN_
folder: /100_HOME/500_WORKOUT/log
fitPanelWidth: true
startDate: 2023-08-01
endDate: 2023-08-31
bar:
title: 'Week Count'
xAxisTickInterval: 1w
``
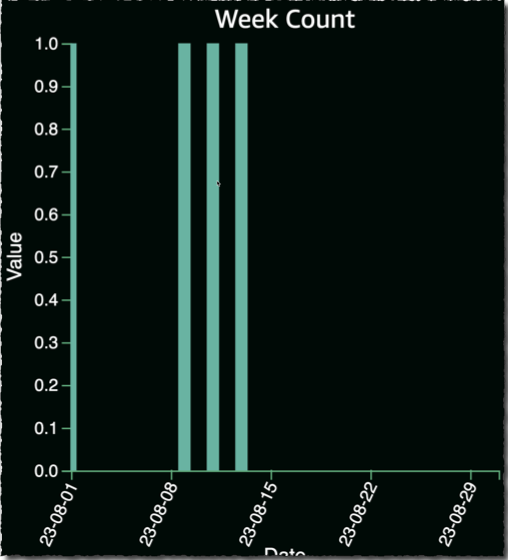
- But this will just draw a bar graph with 1/0 y-axis not a sum, it does put a weekly tick on the bottom ¯_(ツ)_/¯
- I know there are expresions like
sum(Dataset): numberbut no idea where to tell it use this for the Y axis and summarise one bar per week. - Unless the plugiin does not support this, which could also be a answer.