We had a previous thread on this topic, now closed, that was the precursor to this version of my Daily Trading Note (DTN). It has changed quite a bit, and I thought I would put a “How To” post out here to show how I am doing it now to help others, and also solicit input from other traders to make it better. The DTN includes the following:
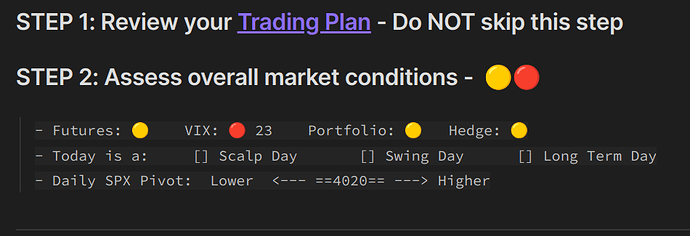
- Review of Trading Plan (use square brackets to link to plan)
- Overall Market Assessment (manual input)
- Daily Profit/Loss Table (calculated with dataview)
- Today’s Trades (text description with tags and links)
- Before Market Open (BMO) and After Market Close (AMC) Futures Snapshot (images paste from broker)
- Sector Snapshots (image paste from OpenBBTerminal)
- Comments
I initially used a lot of Tradingview widgets, but have since discarded them, as they took up a lot of space and I could get the information elsewhere, so they didn’t add much value.
To implement the DTN, I use 4 plugins: Daily Notes, Templates, dataview and QuickAdd. There are lots of guides on using daily notes and Templates, so I will assume you have that up and running, and will focus mostly on how I build each section within the DTN. Although all sections are important, the Daily Profit/Loss Table is really key for me.
Section 1) Review of Trading Plan - In this section I have a link to a note that is my Trading Plan. It is first in the list, because I consider it imperative to review this document every morning and reinforce my rules.
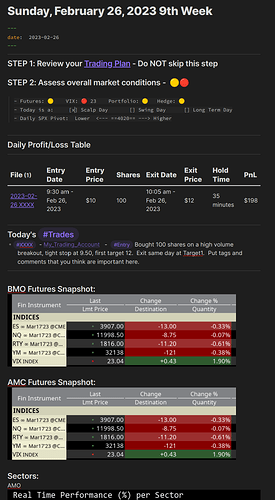
Section 2) Overall Market Assessment - Here I use stoplight colored circles to indicate market conditions for index futures, VIX, my portfolio, and a hedge signal. Each one gets a green/yellow/red ranking, which goes into an overall ranking. I then indicate if I think this is a day to scalp, swing, or long term trade. I also input a key pivot level for the SPX index. All of this is input manually. Here is an image of Sections 1 & 2.
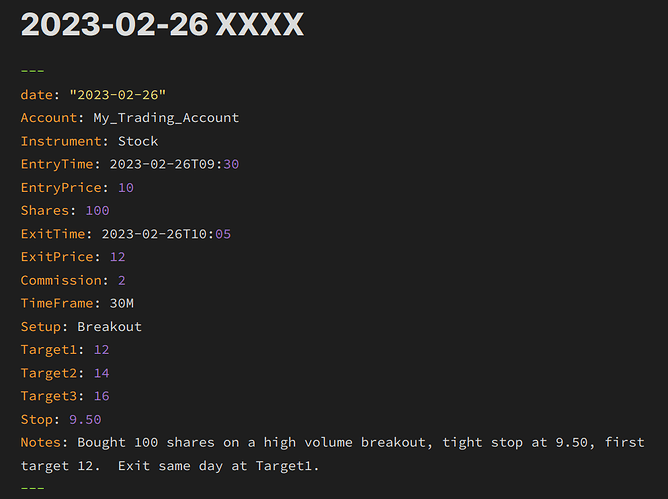
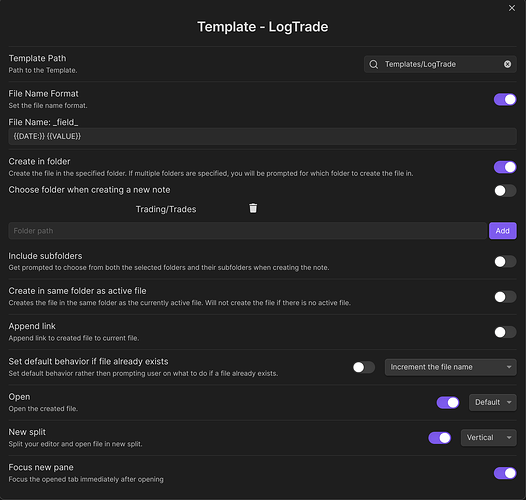
Section 3) Daily Profit/Loss Table - shoutout to supersuper on Discord for helping me with this. It involves three components - a template, dataview code and a YAML file. I set up a template for the YAML file called ‘LogTrade’, which is launched using QuickAdd. Here is a YAML example, where XXXX is the stock symbol:
Here is the QuickAdd setup for the LogTrade template:
When I enter a trade, I press ‘Ctrl-Q’, select the LogTrade template, type in the stock symbol, and enter the trade details. Only the date, EntryTime, EntryPrice, Shares, ExitTime, ExitPrice and Commission are used in the dataview table. The other fields are optional. The YAML files are stored in a folder labeled Trading/Trades. The DTN is stored under Trading/Daily Trading Note.
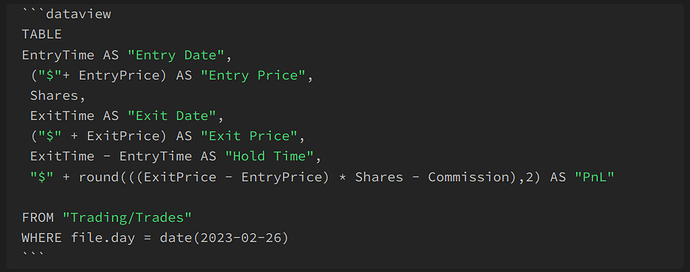
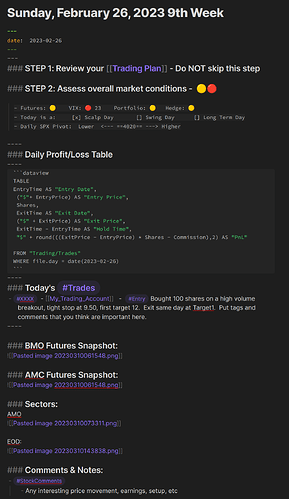
Here is the dataview code:
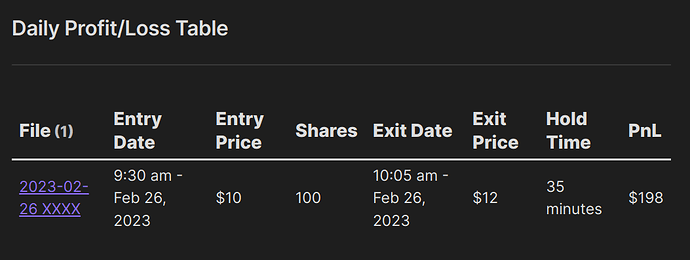
This code is embedded into my DTN template. I modify the date in the file.day line every day to the current day. The Profit/Loss calculation is extremely simple and cannot handle complex trades with multiple entries and exits. Rather than writing complex code, I chose to make modifications to the YAML LogTrade file to get the result I want. For example, if I am trading options, I do not enter the number of contracts, I enter the number of shares represented by the contracts. If I am shorting, the share number is negative. If I have multiple entries/exits, I summarize it into 1 entry/exit. Here is the result:
The PnL table is a recent addition, and I think it is making a difference in my trading. It is in my face front and center all day long - and I really really want to see positive numbers there. I hate it when a negative number shows up. So I work harder to get pluses in this table, not minuses. It may seem kind of silly, but we humans are silly beasts - bottomline, I think this helps me from a psychological viewpoint.
Section 4) Today’s Trades - A more detailed description of trades - setup, why entered, tags, links, important details, comments, did I break a rule? If so, how to fix?
Section 5) Before and After Market snapshots of futures indices and VIX. Cut and pasted from my broker.
Section 6) Before and After Market snapshots of sectors. Cut and pasted from OpenBBTerminal, but there are lots of other sources for this info.
Section 7) A general comment section, alerts, etc.
Below are snapshots in reading mode and source mode. Hope you find this helpful, and please chime in with ideas for improvement.
