What I’m trying to do
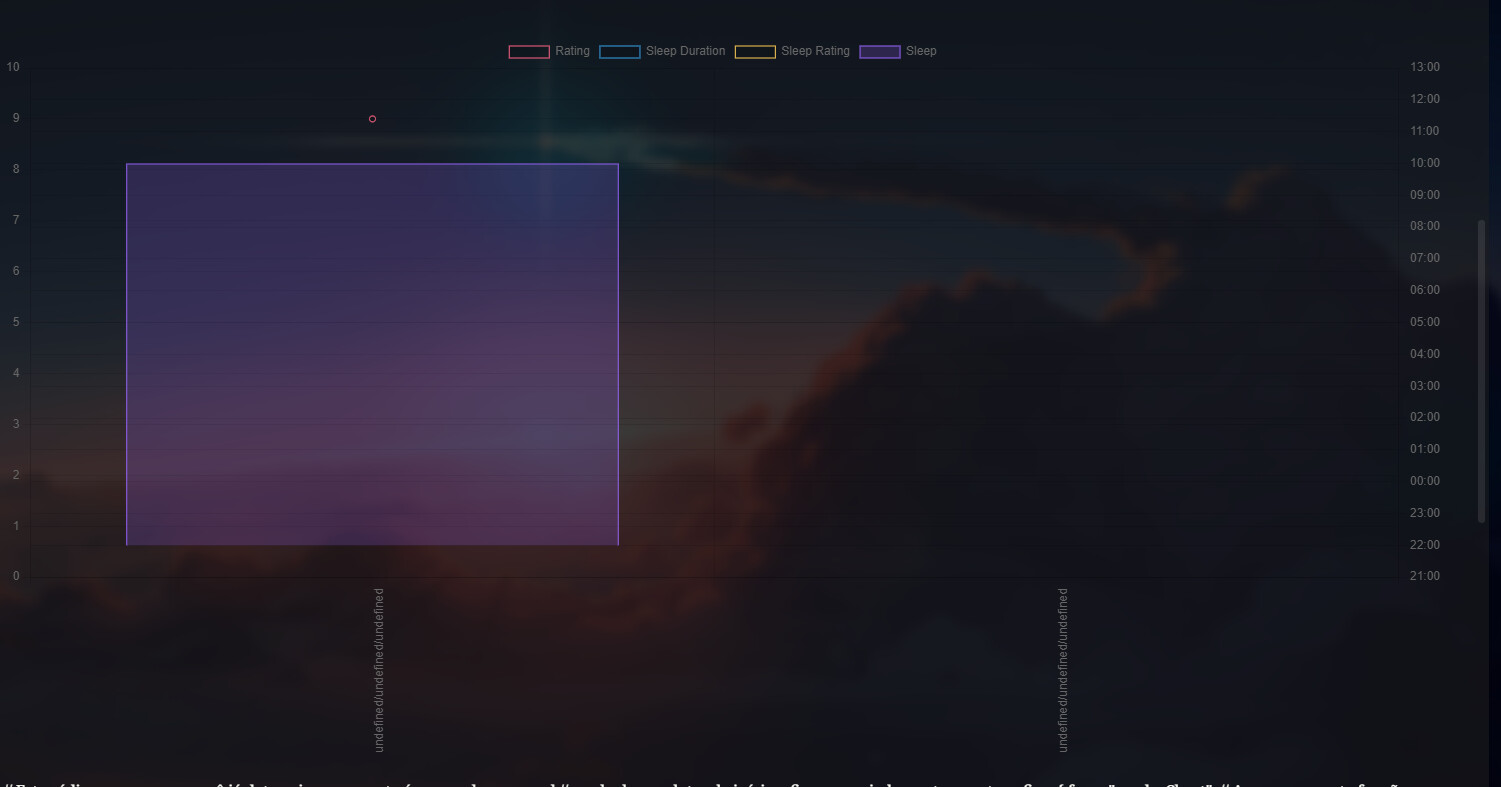
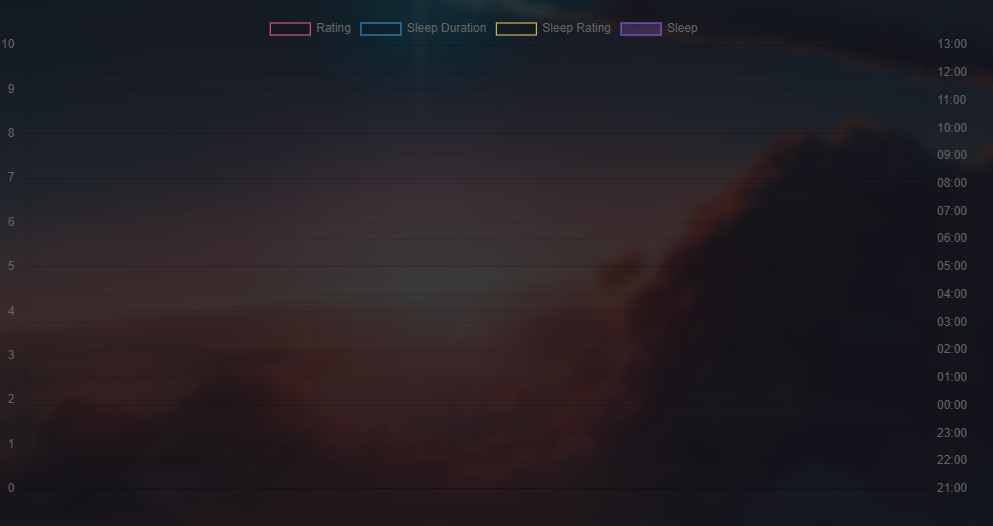
I’ve been trying to solve this for 4 days and I can’t. The graph is displayed, but no data is shown. I don’t know what to do. ![]() S.O.S plugins: dataviewjs + obsidian charts
S.O.S plugins: dataviewjs + obsidian charts
main codeblock:
const settings = {
    func: window.renderChart,
    start: "2024-01-28",
    end: "2024-02-03",

}
await dv.view("Dispensa/Views/SonoUnificado", settings)
Script
let pages = dv
    .pages('"Jornada/Notas Diárias"')
    .filter(p => p.date.day != undefined)
    .filter(p => p.SleepStart!= undefined)
    .filter(p => window.moment(p.date.day).isAfter(window.moment(input.start)) && window.moment(p.date.day).isBefore(window.moment(input.end)))
    .sort(p => p.date);

if (input.range) pages = pages.slice(input.range * -1);

let timeDate = pages.date;
const ratingData = pages.rating;
const sleepStart = pages.sleepStart;
const sleepEnd = pages.sleepEnd;
const sleepRatingData = pages.sleepRating;

const sleepStartStop = sleepStart.values.map((value, index) => {
    return [value, sleepEnd.values[index]];
});

const sleepStartStopNumber = sleepStart.values.map((value, index) => {
    let start =
        (parseInt(value.split(':')[0]) * 60 + parseInt(value.split(':')[1])) / 60;
    if (start > 20) {
        start = start - 24;
    }

    const end =
        (parseInt(sleepEnd.values[index].split(':')[0]) * 60 +
            parseInt(sleepEnd.values[index].split(':')[1])) /
        60;

    return [start, end];
});

const sleepTime = sleepStartStop.map(value => {
    let startDate = moment();
    const endDate = moment('2022-06-16T' + value[1]);

    const startHour = parseInt(value[0].split(':')[0]);
    if (startHour > 16) {
        startDate = moment('2022-06-15T' + value[0]);
    } else {
        startDate = moment('2022-06-16T' + value[0]);
    }

    return endDate.diff(startDate, 'minutes') / 60;
});

timeDate = timeDate.values.map(e => `${e.day}/${e.month}/${e.year}`);

const chartData = {
    beginAtZero: true,

    data: {
        labels: timeDate,
        datasets: [
            {
                yAxisID: 'A',
                type: 'line',
                label: 'Rating',
                data: ratingData.values,
                borderColor: ['rgb(255, 99, 132)'],
                borderWidth: 1,
            },
            {
                yAxisID: 'A',
                type: 'line',
                label: 'Sleep Duration',
                data: sleepTime,
                borderColor: ['rgb(54, 162, 235)'],
                borderWidth: 1,
            },
            {
                yAxisID: 'A',
                type: 'line',
                label: 'Sleep Rating',
                data: sleepRatingData.values,
                borderColor: ['rgb(255, 206, 86)'],
                borderWidth: 1,
            },
            {
                yAxisID: 'B',
                type: 'bar',
                label: 'Sleep',
                data: sleepStartStopNumber,
                backgroundColor: ['rgb(153, 102, 255, 0.2)'],
                borderColor: ['rgb(153, 102, 255, 1)'],
                borderWidth: 1,
            },
        ],


},
    options: {
        tooltips: {
            callbacks: {
                label: function (t, d) {
                    return 'FFFF';
                },
            },
        },
        scales: {
            A: {
                type: 'linear',
                position: 'left',
                beginAtZero: true,
                min: 0,
                max: 10,

            },
            B: {
                type: 'linear',
                position: 'right',
                max: 13,
                min: -3,

                ticks: {
                    fontSize: 40,
                    count: 17,
                    maxTicksLimit: 20,
                    callback: function (value, index, ticks) {
                        if (value < 0) {
                            value = 24 + value;
                        }
                        let minutes = value * 60;
                        let hours = Math.floor(minutes / 60);
                        minutes = minutes % 60;

                        if (minutes < 10) {
                            minutes = '0' + minutes;
                        }
                        if (hours < 10) {
                            hours = '0' + hours;
                        }

                        return hours + ':' + minutes;
                    },
                },
            },
            x: {
                ticks: {
                    maxRotation: 90,
                    minRotation: 90,
                },
            },
        },
    },
};

input.func(chartData, dv.container);