It’s not really usable, you have to manually save graph and restore it every time you open graph view. Yes there is automatic restore option in the settings but there’s latency and just looks not really good.
I wish for this feature so bad, it would really help me not getting lost in my notes ^^
+1 absolutely agree with this. it would turn the graph into a map you can literally navigate and think about even when you’re not looking at it.
+1 for this - would love to organize things in 2 dimensions
This is unbelievable, I think I might save this and put it in reddit ![]() There are 10K views and hundreds of people who have been wanting this feature for 4 years and this is still open?
There are 10K views and hundreds of people who have been wanting this feature for 4 years and this is still open?
I am just curious about why these nodes move. Besides making them look “cool”, I do not see any usefulness to it. In fact, this is probably one of the worst features of this app. You have to look at it from the users POV. I am trying to have a clear idea of how things are connected, the graph is a visual aid for people like me, who are visual in their thinking. But you created a graph that for some reason just keeps moving distracting the user from whatever connection he wants to envision in the graph. And a feature that should be trivial like a switch to freeze the graph, is not just not available… I might be wrong, but this makes no sense.
Hello Again,
So, I think this graph thing can be made usable with:
- Adjust the forces. Center Force and Repel force need to be zero, while Link force needs to be very small, but bigger than zero:
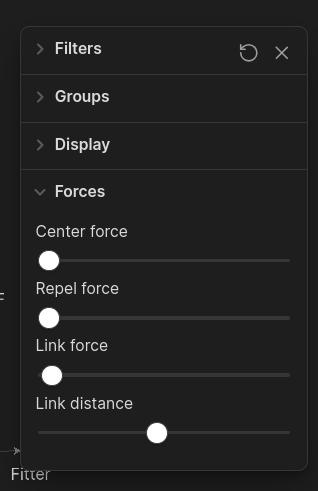
Then you can find whatever layout makes sense to you
- You need to download a plugin called
Persistent Graph. ThenSave graph node positionsin the command palette on the left side:
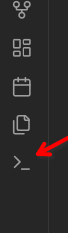
And you save it.
Hello yet again,
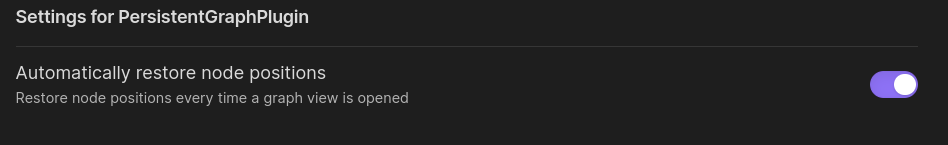
I forgot to tell you another thing. The plugin can restore automatically the positions by doing:
-
Click on settings wheel
-
Click on plugin

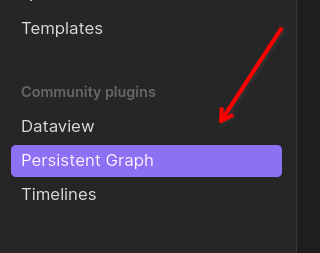
- Select:
I am also waiting for this for a very long time. Don’t want to use a plugin… should I?
+1 on making a feature where you can toggle to move and pin individual notes and have the position saved no matter what
mainly trying to see if I can use Obsidian to plot out a complicated story with multiple arcs and different story lines for each character and allot of character info and world-building and linking them all back to the main storyline. I’ve used notion before but kinda hard to do anything too complicated link wise and I’m a visual person so was hoping this will help me keep my head on straight when thinking of the plot.
so i tested the plugin. and well if your not doing anything complicated it kinda works? but if you insert new notes between notes or put them in folders or change links or basically do anything that’s not typing to the existing notes it’ll all unpin and go back to the default graph view where its all mixed up. ![]()
as someone previously mentioned it looks like the graph view as a whole is more of a gimmick to just look at something or put on a PowerPoint than help you organize your notes. ill have to look at other options TT-TT
+1. I would really appreciate this feature <3.<3
If I can jump to specific node, it is very helpful… please refer below…
+1, this feature would be awesome because if the graph view looks different every time, I can’t find the same nodes as easily and I can’t memorize the graph as a “map”
I really need this feature. It’s stopping me from using Obsidian more.
I can appreciate that it’s difficult to implement user requests at a whim but in certain cases, a request can be so important that it makes or breaks the tool. And that’s what it going on here. If you permit me, I will explain:
Graphs, Self-organisation, Controlled Chaos and Mindmaps
Graphs are meant to be a visual aid in the process of human perception. It turns absolute chaos (an incomprehensible amount of data) into something a human can approach without feeling overwhelmed. Graphs attempt to help us make sense of large amounts of information. A good concept to compare this to are mindmaps.
With mindmaps, we have to manually create the layout outselves entirely though. So for large datasets, this is impractical. This is why we use force directed algorithms to help us with this. And this makes sense: based on the parameters you dial into the settings, different representations of the same data can be achieved; but these different representations still have a certain amount of logic to them.
When you look a programs like Gephi, it allows you to run the algorithm for a certain amount of time, enough for it to organise the nodes and have clusters self-organise. Then you can save the state. When new data is added, you can let the algo run again but it starts from the saved state, not from the beginning.
Ultimately I do not know how Obsidian calculates their graph… and the functionality that we ask for could be unreasonable to implement with the software as it is. But this is one of those things where a seemingly tiny detail, can make an otherwise good tool, completely unusable. Think of a Ferrari with a broken transmission belt… You can still hit the gas, but you’re not going anywhere.
Devs, all you need to do to permanently fix this issue is offer a simple function in the context menu of a node: “Pin node to coordinate”
The point is not to pin every single node, but to pin the most important ones. Yes, due to the clustering effect, important nodes already are somewhat forced in place, but every time the graph reloads, they change their position relative to the rest of the graph. And this makes the tool unusable. What users want is a way to FAMILIARISE themselves with their data. If the visual representation of their data changes every time they reload, the LITERAL entire point of having a graph view in the first place is completely and utterly lost.
And frankly, I’m baffled that after more than 4 years, this has not yet dawned on the developers.
This doesn’t inspire confidence for user to sign up for paid subscriptions either.
My personal use case for obsidian is that I use it as a visual file indexer as well. I download all of my source material, pdf’s, texts, screenshots, forum posts, videos, whatever and will link them to the concepts that I’m studying. By doing this, I’m not only creating footnote sources/quotes for my own thinking/studying but I’m also indirectly generating an index for my media files so that file retrieval times are reduced; because the links to the media files are navigator tools.
However, using the graph view for file navigation retrieval is severely restricted because every time I reload the view, the entire context, the map, resets and I get lost. And on top of this, it does not allow me to form a Mind Map in my head of the information. Like a Mind Palace. If there is no method of loci to the graph view in Obsidian, there is no reason to use it.
It’s literally like trying to learn something but at the end of the day you’re forced to drink a potion that makes you forget everything you learned the next morning.
And therefore, all Obsidian is useful for is taking notes; not organising them. And that’s why the tool is increasingly losing interest: because most people don’t see its raison d’être…
Tell me, perhaps I’m missing something, but please do tell me the practical function of the graph view (a visual representation of data) if the representation randomly changes every time you reload it.
What is the point?
Seriously.
How about checking plugins for solutions?
Eg persistent graph?
persistent graph doesn’t work; it’s like trying to hold everything together using duct tape. It’s a good effort, but it’s not a solution.
Most of my time I use the local graph, because the global graph is too messy.
But I’d like to have use for the global graph too.
Therefore, the only route to go is to check out multiple graph plugins.. I didn’t suggest THE plugin to use. There are much more in the list.
Asking for some core corrections/ implementations will take time if a requested feature is important.
to render the global graph in a more useful way, I think it’s better to render it with something else entirely. Write a script that fetches all the links and formats them into dot files so you can render them in graphviz which actually allows you to pin nodes to specific coordinates