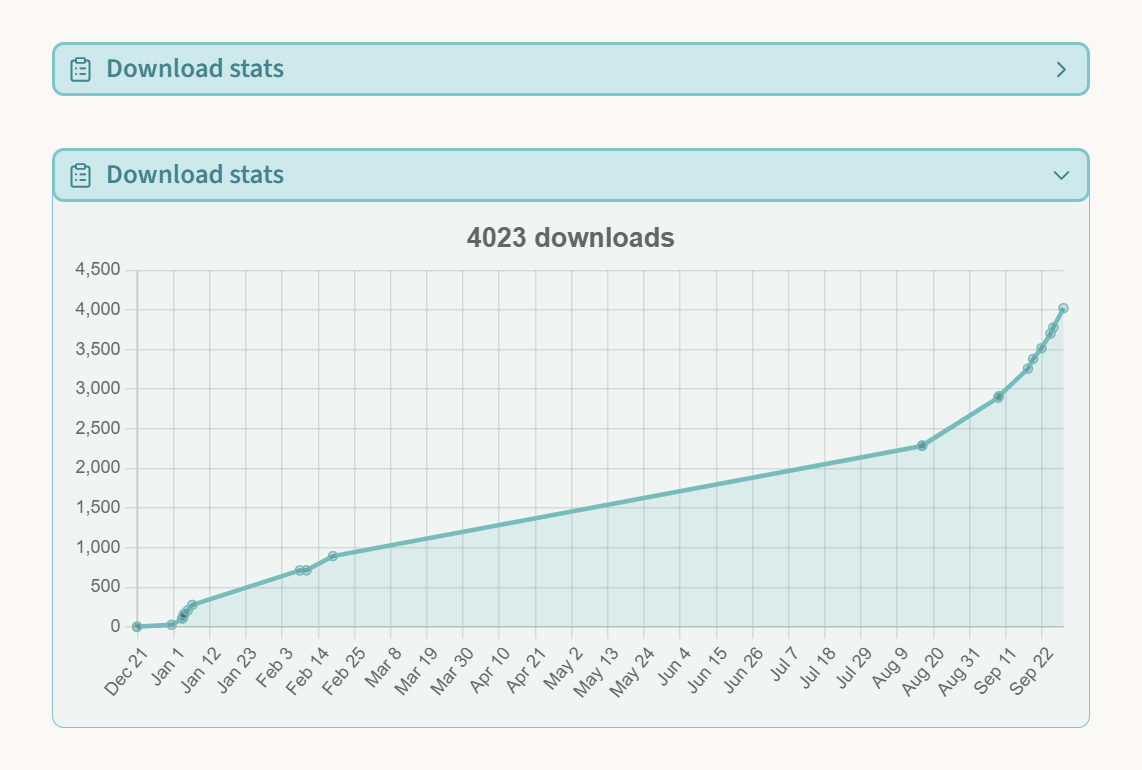
I’ve wanted to insert a dynamic plot of my plugin’s download counts in my note (x=version, y=# of downloads).
Update (older version follows)
Thanks to @AlanG, it turned out that Octokit is unecessary, and therefore I don’t have to rely on Obsidian Modules (although it’s super useful for other purposes, too). The following is the updated solution:
-
Install Obsidian Charts and Dataview. Enable DataviewJS.
-
Create this script.js in your vault (replace
"YOUR_PERSONAL_ACCESS_TOKEN"with yours). -
In the note that you want to insert a plot, simply add the following
dataviewjscode block. Also modify the parametersowner,repo,titleandcumulativeas you like.
```dataviewjs
await dv.view("path/to/script", {
owner: "Your GitHub account",
repo: "Your repo",
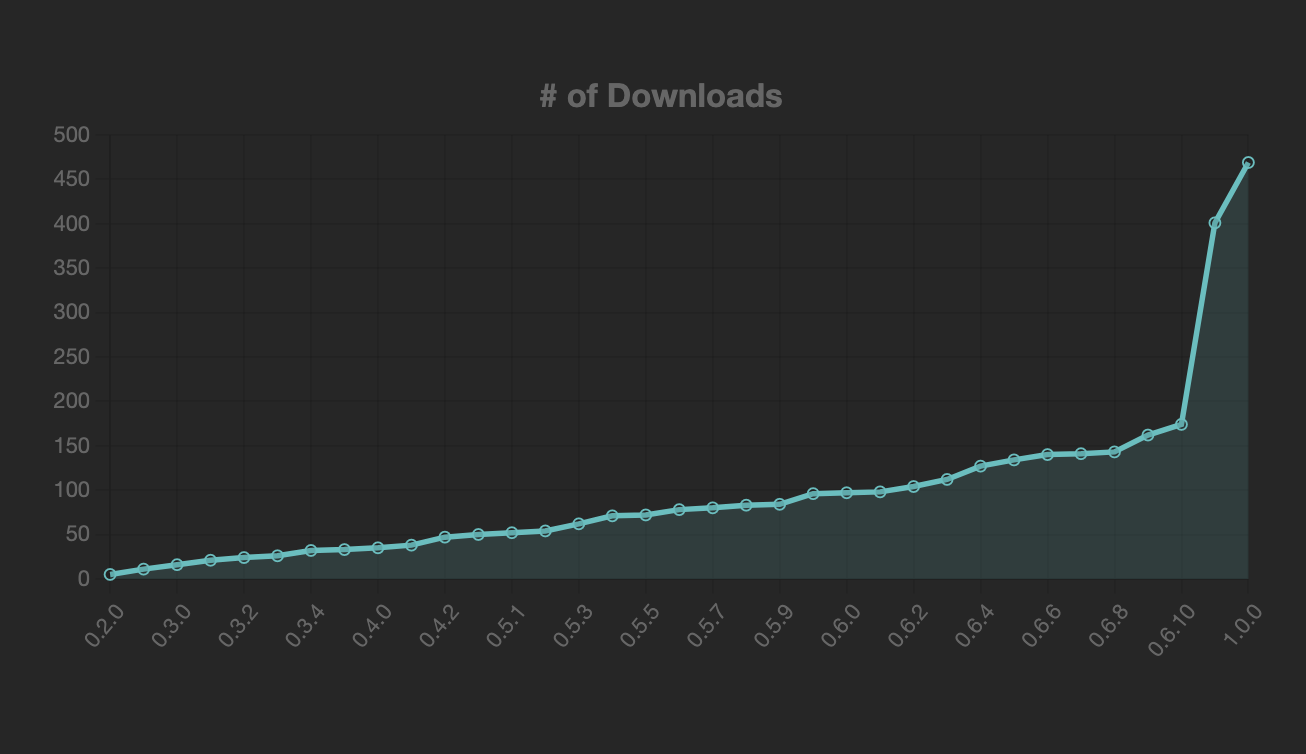
title: '# of Downloads',
cumulative: true,
ctx: this.container,
});
```
- It’s done!
Old version
Once I get the data, I can plot it using DataviewJS and the Obsidian Charts plugin (see here for details).
However, it was not clear to me how I can import the octokit.js (required to get the count data using the GitHub API) in dataviewjs code blocks.
Recently, I finally managed to do that thanks to the awesome Obsidian Modules plugin. So let me share my solution here.
Also, let me know if there’s a better or easier way to do it!
-
In the Obsidian Modules settings, turn on “Enable external links”.
-
Create the following
script.jsin your vault (replace"YOUR_PERSONAL_ACCESS_TOKEN"with yours).
// load octokit.js using Obsidian Modules
const { Octokit } = await self.require.import("https://esm.sh/@octokit/core");

// get download count
const octokit = new Octokit({auth: "YOUR_PERSONAL_ACCESS_TOKEN"});
const releases = (await octokit.request(
    `GET /repos/${input.owner}/${input.repo}/releases`,
    {
        per_page: 100,
        page: 1,
    }
)).data;
const download_counts = releases.map((release) => { return { version: release.tag_name, download_count: release.assets.find((asset) => asset.name == 'main.js').download_count } }).sort((a, b) => a.version.localeCompare(b.version, undefined, { numeric: true }));

if (input.cumulative) {
    download_counts.forEach(
        (item, index) => {
            item.download_count += (index > 0 ? download_counts[index - 1].download_count : 0);
        }
    );
}

// prepare data for Obsidian Charts (Chart.js)
const data = {
    type: 'line',
    data: {
        labels: download_counts.map(row => row.version),
        datasets: [
            {
                data: download_counts.map(row => row.download_count),
                borderColor: 'rgb(75, 192, 192)',
                legend: false,
            }
        ]
    },
    options: {
        fill: {
            target: 'origin',
            above: 'rgba(75, 192, 192, 0.15)',
        },
        plugins: {
            title: {
                display: true,
                text: input.title,
                font: {
                    size: 18,
                }
            },
        }
    }
};
// draw line chart
window.renderChart(data, input.ctx);
- In the note that you want to insert a plot, simply add the following
dataviewjscode block. Also modify the parametersowner,repo,titleandcumulativeas you like.
```dataviewjs
await dv.view("path/to/script", {
    owner: "Your GitHub account",
    repo: "Your repo",
    title: '# of Downloads',
    cumulative: true,
    ctx: this.container,
});
```
- It’s done!