No colors with Obsidian Charts dataviewjs query

What I’m trying to do

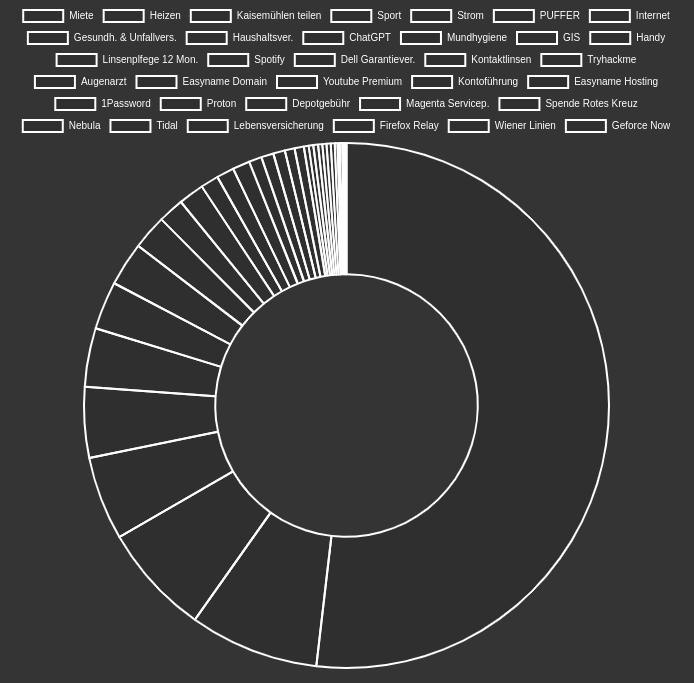
i try to get my monthly expenses as a pie chart. i successfully did that with the dataview integration of the obisidian charts plugin. but its only black/white


const labels = [];
const tagPages = dv.pages('#fixkosten');
const kosten =[];

tagPages.forEach(note => {
    // add the name of the note
    labels.push(note.file.name);
    // add the word count for the note
    kosten.push(note.Entspricht);
});

const chartData = {  
    type: 'doughnut',
    data: {
        labels: labels,
        datasets: [{
            data: kosten
        }]
    }
}

window.renderChart(chartData, this.container);

Things I have tried

  • adding “labelColors: true,” anywhere in the const ChartData section but it has no effekt
  • creating a chart without a dataview query prints out a colored chart

Got same problem here.
I found that obsidian-charts only adds the default colors when parsing yml.
Thus, I managed to work around with something like

const labels = [];
const tagPages = dv.pages('#fixkosten');
const kosten =[];

tagPages.forEach(note => {
    // add the name of the note
    labels.push(note.file.name);
    // add the word count for the note
    kosten.push(note.Entspricht);
});

dv.paragraph(`\`\`\`chart
	type: 'doughnut'
	labels: ${labels}
	labelColors: true
	series:
	- data: ${kosten}
\`\`\``)

If you really want to use window.renderChart, you may consider building your own obsidian-chart plugin with dependency chart.js ^4.0.0, then you will get some default colors from chart.js.

This topic was automatically closed 90 days after the last reply. New replies are no longer allowed.