Sorry if this is going to be a little overwhelming, but there are three main criteria for me to consider a habit tracker plugin, or put another way what I would want out of such a plugin. Two visual criteria, and one data based related:
- The possibility to track multiple habits in the same view
- A clear indication of streaks (preferably across weekends, as well)
- An easy, intuitive(?) way to input the data
Not so important, but nice to have features:
- A popup showing details for a given day
- Variable width/weight for the individual habits
- Potentially a legend showing the color of the various habits
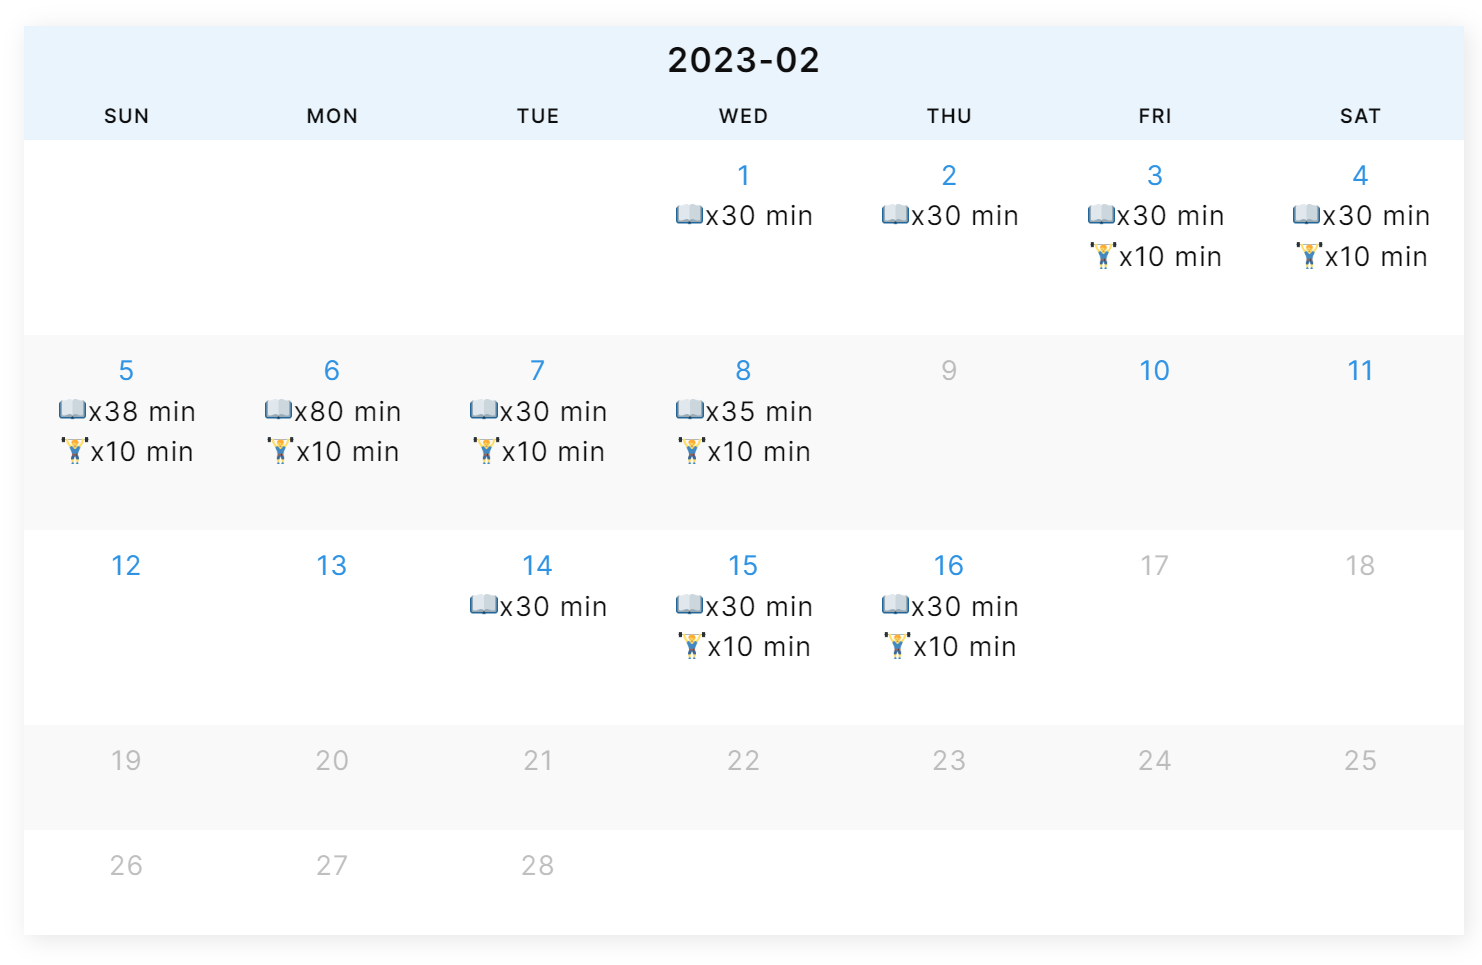
Here is a mockup for a view resembling what I would like:
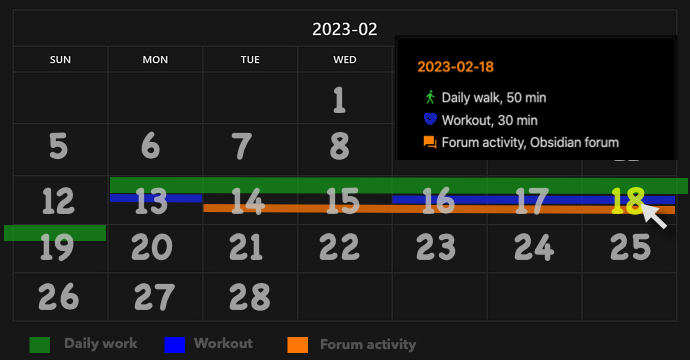
In this image we see that the green habit, Daily walk, has double the width of the other habits, and there is an ongoing streak from the 13th, through the weekend (shown by “extending” outside of the calendar) into the 19th. The blue habit, Workout, has a gap with a little weekend streak. The orange habit, Forum activity, has a streak starting on 14th going through 18th, but it ended on the 18th.
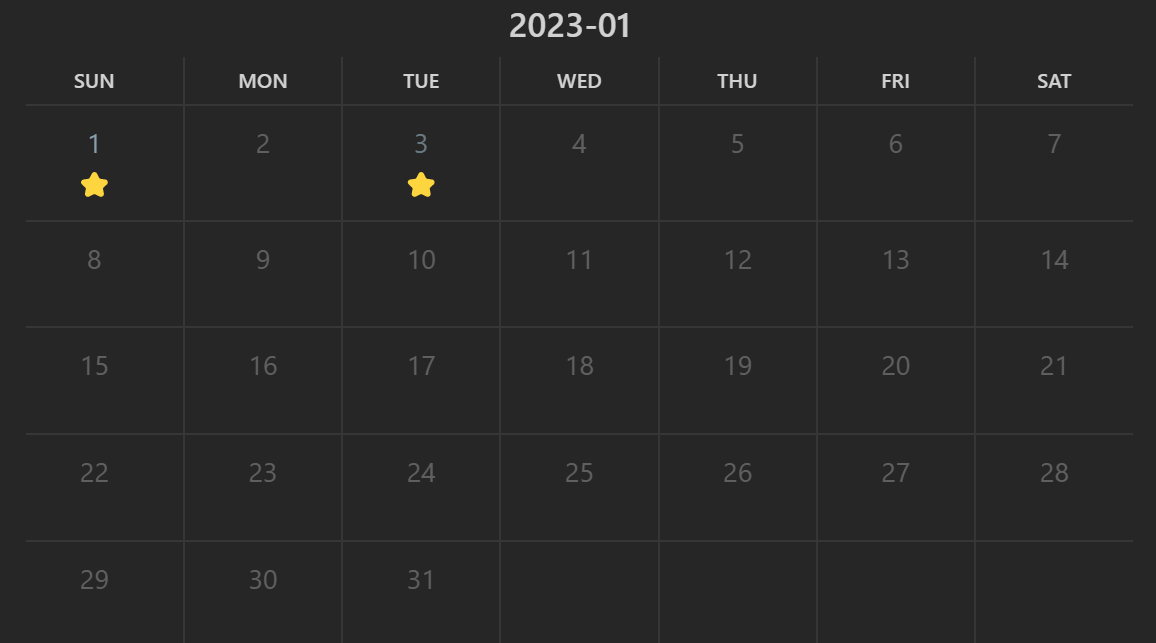
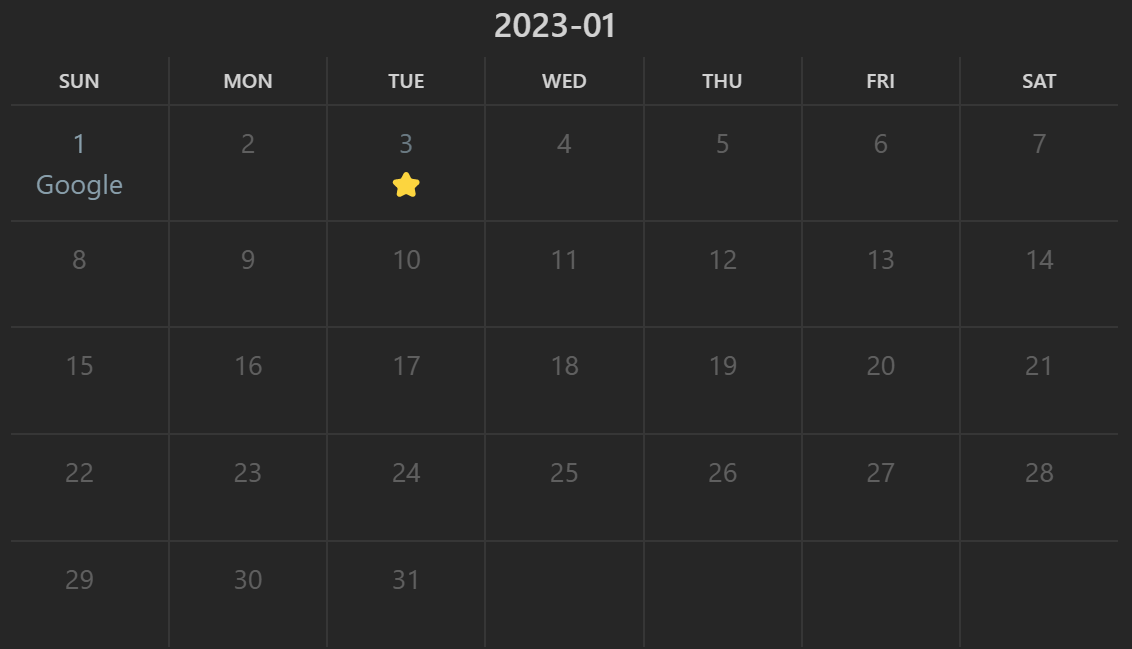
In addition, the popup shows the details from the 18th, utilising the original data used for creating this view. In image form this would look like:
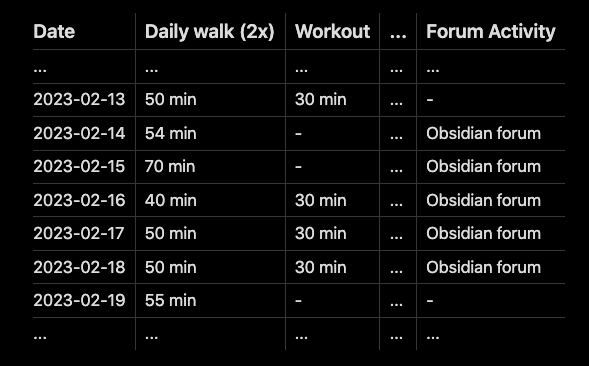
Mockup of habit data table
Here is a manual mockup of the data table presumably used for the image above. Ideally this is the output from a TABLE query, which would gather the data from the current month.
| Date       | Daily walk (2x) | Workout | ... | Forum Activity |
| ---------- | --------------- | ------- | --- | -------------- |
| ...        | ...             | ...     | ... | ...            |
| 2023-02-13 | 50 min          | 30 min  | ... | -              |
| 2023-02-14 | 54 min          | -       | ... | Obsidian forum |
| 2023-02-15 | 70 min          | -       | ... | Obsidian forum |
| 2023-02-16 | 40 min          | 30 min  | ... | Obsidian forum |
| 2023-02-17 | 50 min          | 30 min  | ... | Obsidian forum |
| 2023-02-18 | 50 min          | 30 min  | ... | Obsidian forum |
| 2023-02-19 | 55 min          | -       | ... | -              |
| ...        | ...             | ...     | ... | ...            |
The idea is simple, to re-use the data straight out of a table (preferably made by dataviewjs, where there is one row for each day with habit data, where the first column is always the date, and the following columns are the habit one would like to track. If a column has any value, it’s shown as a line for that date, and the value is inserted into a div (hidden by default, but visible when hovering the date).
The column header is used to identify the habit (and could possibly be used in showing a legend), and used in the popup. If the header ends with (Nx) it signifies the weight of this habit compared to the others.
Using the output of a table query would make it a whole lot easier to populate a habit calendar, as we could then opt for all kinds of methods for tracking the habits, as long as it’s doable to put it into a table. And we wouldn’t have to “massage”/“manipulate” the data through more or less intricate methods to be accepted by the plugin.
Some practical tips related to coding this
I’m imaging the popup div to be populated but having a display: none when creating the table, and then using :hover on the date cell to display it. This I think would be better than displaying the daily note, as the daily notes could be long and not neccessarily have the “habit data” at the top ready to be shown in the popup. The daily note would still be available by clicking on the day cell.
Regarding the weights, if the inner height of a cell is a multiple of 24, one could easily accommodate weights like 1, 2, 3, and 4, since 123*4 = 24. This would ensure nice crisp lines within the cells. (It would also make weights of 6, 8, and 9 be crisp, so given a little knowledge about this, one could easily allow for neat crisp habit lines).
Using the “any value” to signify a habit completion, would both allow for easy tracking, but also for more interesting popup values, as they could then either be copied verbatim, or prefixed with the habit name. Another option could even be to just join the various values for that day into a simple list, either like “Daily walk, 30 min - Workout, 50 min - Forum Activity, Obsidian forum”, or if skipping the headers using some other texts in the column: “Walked around the lake, workout 50min, a few hours on the Obsidian forum”.
Preferably there would a settings pane allowing to select the various color to maintain a proper scheme. This could possibly utilise color like the already defined var(--color-orange) & co and/or rgb values. Allowing for the variable color definitions, it would be easy to style this plugin accordingly to the color scheme already set for the theme.
Some more details on the TABLE query output
When using dataviewjs you’ve got the option to do queries like:
```dataviewjs
const result = await dv.query(`
  TABLE walk as "Daily Walk (2x)", workout as "Workout", forum as "Forum Activity
 FROM "daily notes"
WHERE period = date(2023-02)
`)

if ( result.successful ) {
  const values = result.value.values
  // For displaying as a table
  // dv.table(result.value.headers, result.value.values)

  // For display as Habit Calendar (possibly? )
  renderHabitCalendar(this.container, {
   year: 2023, month: 2    // or maybe: month: date(2023-02),
    habits: result.value.headers,
    entries: result.value.values,
    width: "100%"
  })
} else
  dv.paragraph("~~~~\n" + result.error + "\n~~~~")
```
This would allow for easy verification of your input data, as you could just switch to (or add) the dv.table() variant, and there would be no complications getting to show the habit calendar based on your query.
So that’s some of my thoughts on what I would like out of a habit plugin. If only I had the time to program it, the world would be a better place. But you seem to have gotten a solid base so far, so maybe some of these ideas of mine would be suitable for incorporation into your plugin?