Hi there!
I’ve just released ![]() Grafika 0.6.0, a first version of a plugin to create dashboards with interactive visualizations like
Grafika 0.6.0, a first version of a plugin to create dashboards with interactive visualizations like ![]() charts,
charts, ![]() plots and ⯻ graphs, embedded inside Obsidian’s notes.
plots and ⯻ graphs, embedded inside Obsidian’s notes.
![]() I still didn’t submit this plugin for approval, but you can give it a try via BRAT:
I still didn’t submit this plugin for approval, but you can give it a try via BRAT:
GitHub - anteloc/obsidian-grafika-plugin: Obsidian plugin for creating plots, charts and graphs via Apache Echarts , Chart.js and visjs.
![]() Video
Video
![]() Screenshots
Screenshots

![]() Main Features
Main Features
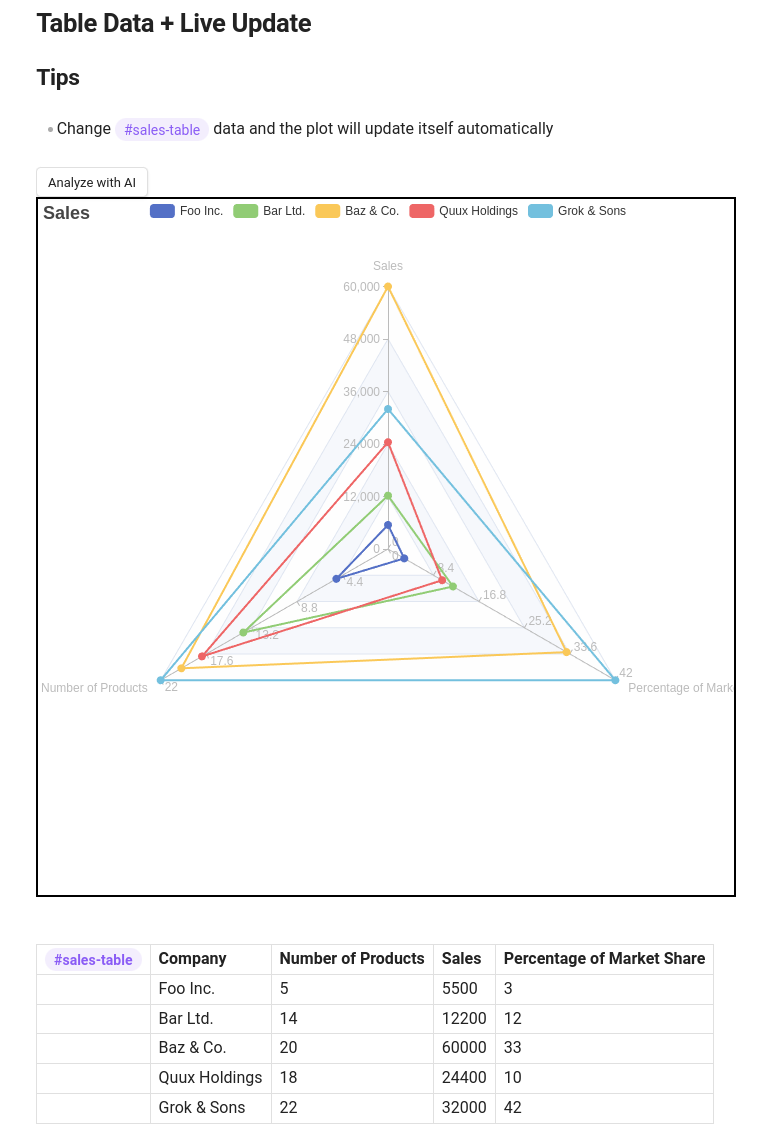
- Create Markdown notes with embedded visualizations of different kinds.
- Build & Share Dashboards with interactive and live charts, graphs and plots.
- OpenAI’s Analysis
- Get AI Insights for a plot just by clicking a button!
- Customize the analysis by configuring your own System and User prompts
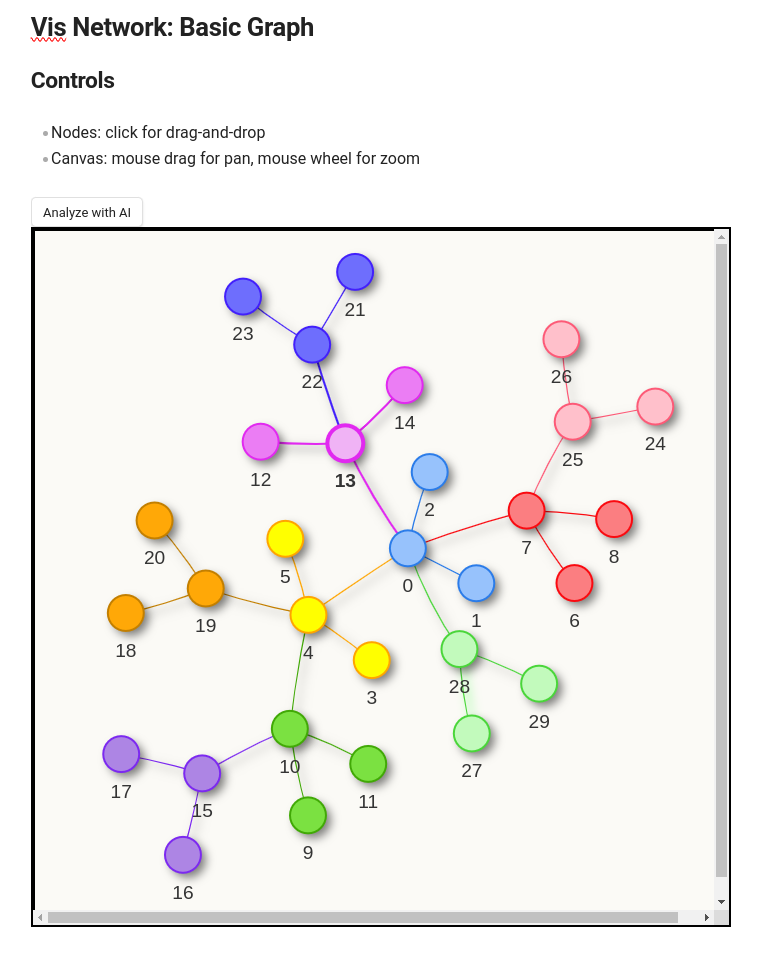
![]() Write JavaScript code fence blocks for rendering visualizations with different libraries: Apache ECharts, Chart.js, visjs (network and timeline graphs only!)
Write JavaScript code fence blocks for rendering visualizations with different libraries: Apache ECharts, Chart.js, visjs (network and timeline graphs only!)
![]() Adapt & Reuse Examples
Adapt & Reuse Examples
There are plenty of code examples at the websites for the supported Visualization Libraries. Many of them are easy to adapt to code fence blocks, saving a considerable amount of time:
- Copy-and-paste example code directly into a code fence block.
- Adapt the example code according to the instructions (WIP).
- Click outside the code fence block to see the results.
![]() Current Status
Current Status
This plugin is still WIP and also experimental, but already usable.
Any feedback and new ideas for improvement, documentation, etc. are welcome, especially regarding UI/UX.
I hope you enjoy it! ![]()