I’m excited to announce that my Extended Graph plugin for Obsidian is officially released today! Images, shapes and more can now be added to the graph view
Like many, I never found the default graph view particularly useful beyond occasional local graphs. I wanted something with the powerful visualization features of https://kumu.io/ but with the privacy and local storage benefits of Obsidian. So I built this plugin to enhance the core graph with features I wanted, and then kept adding improvements based on community requests found mainly on the forum.
I’ve made everything super customizable - you can toggle each feature on or off individually for both local and global graphs. The plugin only activates in the graphs where you want it, so you can install it just to use the SVG export feature without being bothered by all the other capabilities.
Features:
Add images directly to the graph nodes
Visualize tags and properties (with Dataview support) as colored arcs around nodes
Color and filter links based on relationship types
Use curved links and distinguish between forward/backward connections
Assign different shapes to nodes based on content type
Scale up the node for your currently active file
Apply statistical metrics to modify node/link sizes and colors
Export your graph as an SVG file
Pin nodes to fixed positions
Save and switch between different graph configurations
Zoom directly to specific nodes
Check out the plugin repo for more details - I’ve also put together a Wiki with examples and explanations of all the features.
Fair warning: There might be some bugs lurking as well as performance issues for big graphs! The core graph plugin isn’t documented or designed for external extensions, and this is my first major JavaScript project. I’ve done my best to test everything, but if you find issues, please report them on the GitHub issues page!
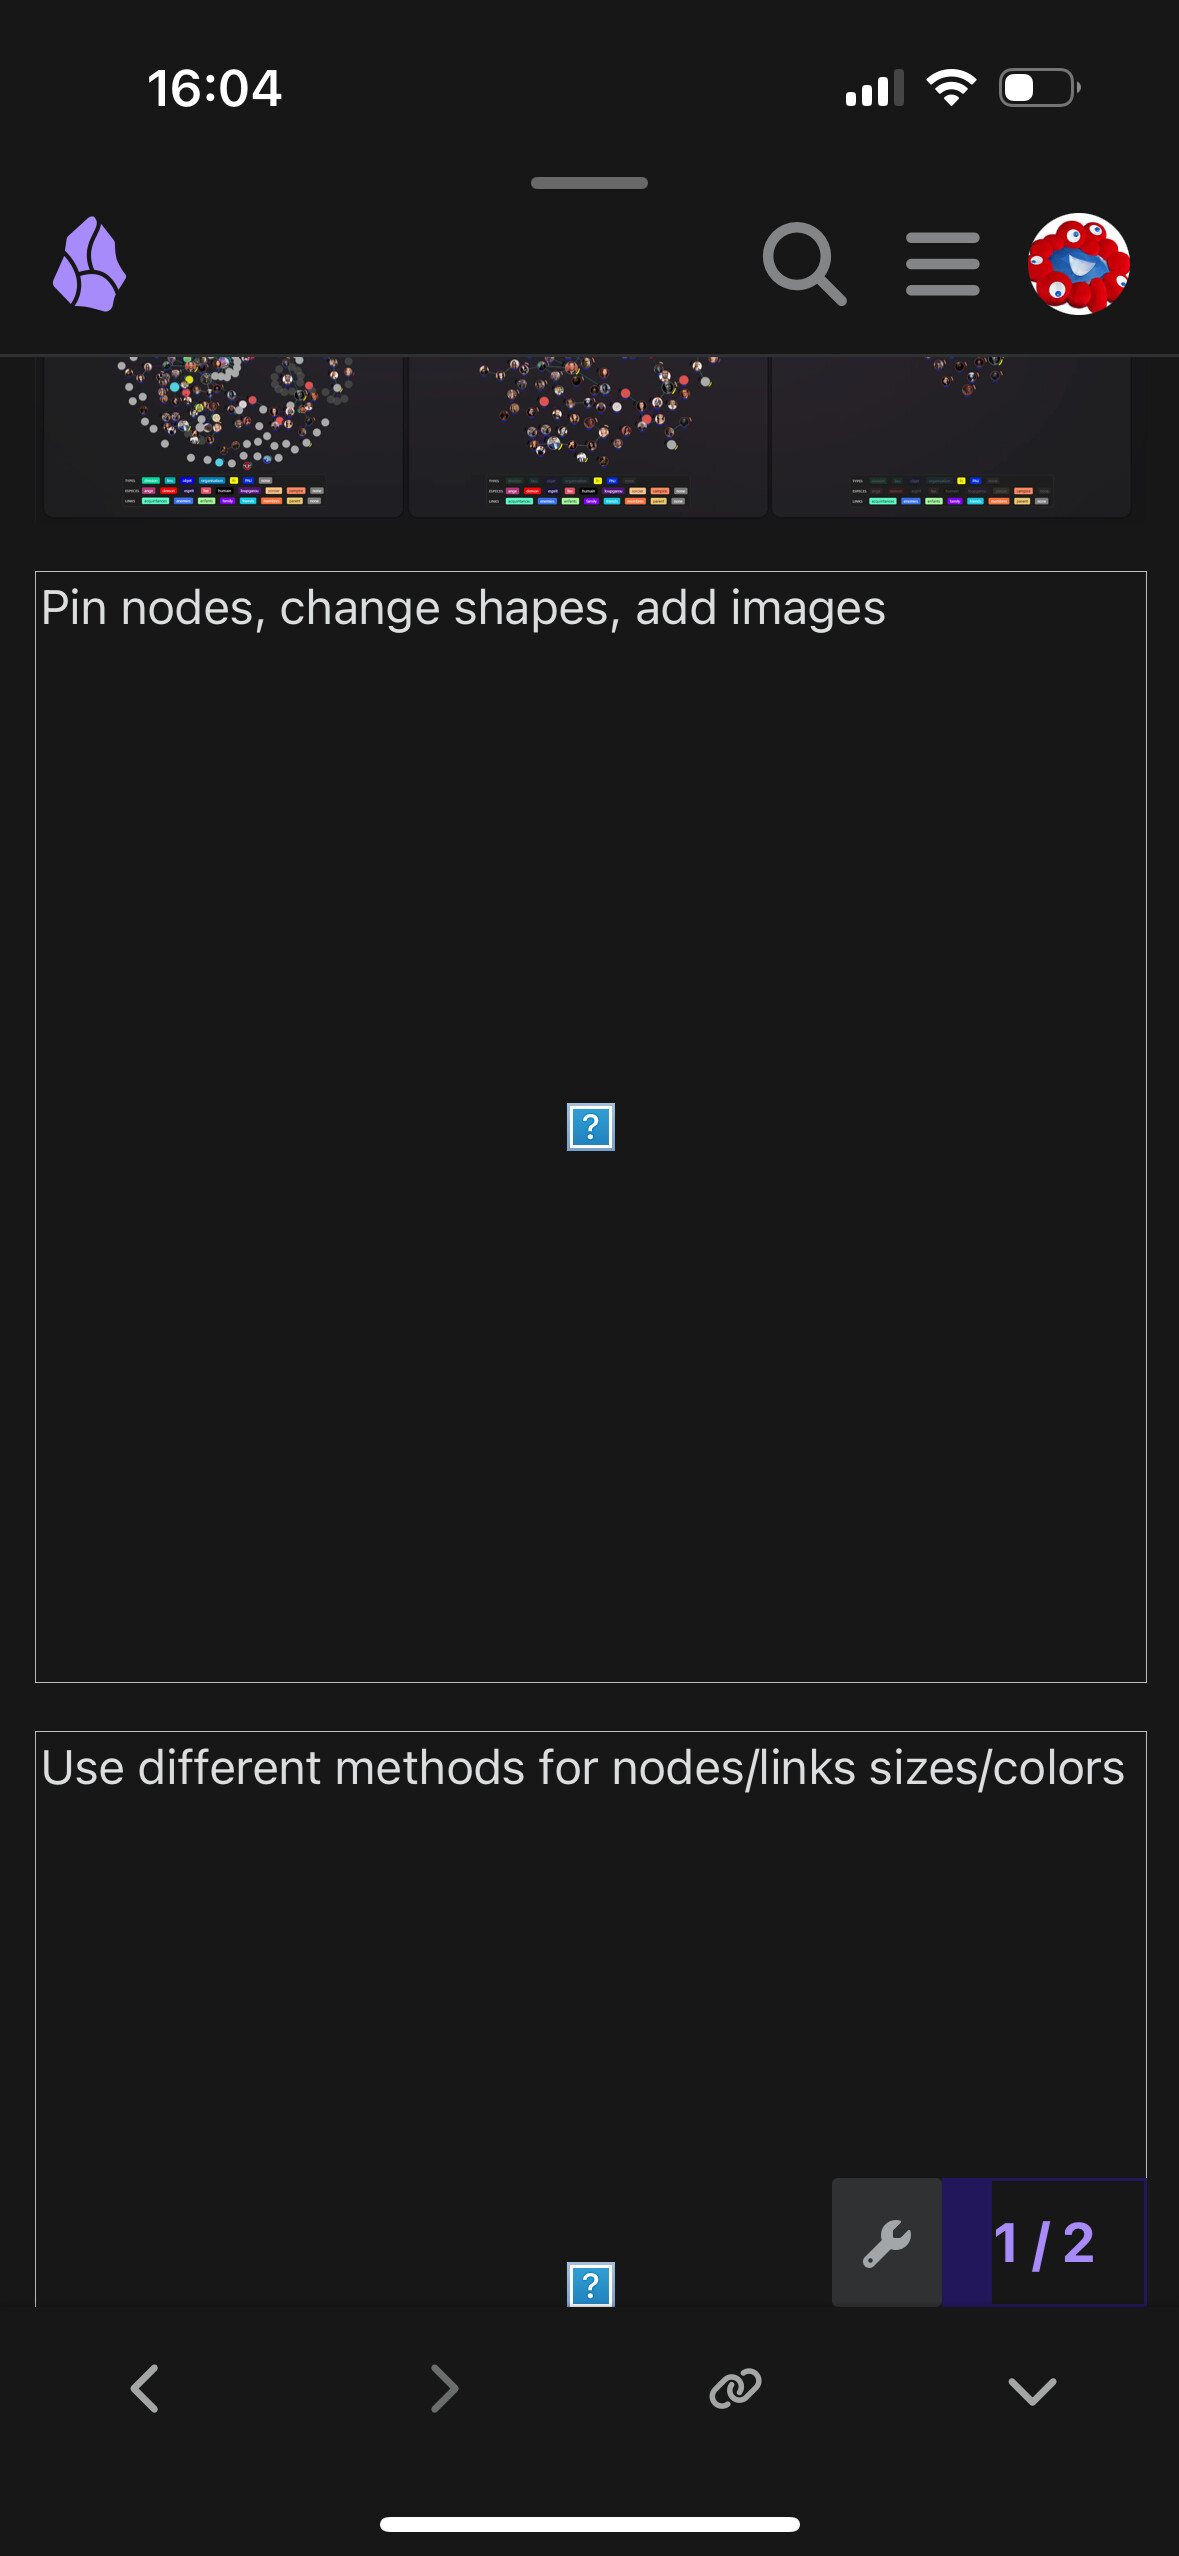
Pin nodes, change shapes, add images:
Use different methods for nodes/links sizes/colors:
Moderators are very shy people and do not allow everyone to edit posts You need to gain some level to do this. Security reasons, forum rules, and it’s right to be like this. As @ariehen mentioned, he or some other moderator will help to fix it.
Yeah, the non-editing is a forum “trust” setting . Once you post a bit more, give and get likes, etc., you’ll be able to edit your posts. Sorry about that!
I fixed up the links; hope everything looks acceptable to you. I changed them to this and so on:
I’m sorry i’m new to obsidian, but every plugin seemed to work for me except this one, is there a way there to be a youtube video about it? or is there something wrong with what i’m doing, since when i make the changes for the colors or something it doesn’t get reflected in the graph view, am i missing something?
No need to be sorry. It’s also possible that my plugin has some bugs, depending on how you use it and what use cases I haven’t thought of when testing it.
Unfortunately there is no video. Not yet at least. I’m tryong to go over all the bugs reports and features requests in order to make a video with something as stable as possible and that will showcase the plugin in its most advanced state. So it should come but later.
I did make a wiki though. If you haven’t read it, here is the link: Home · ElsaTam/obsidian-extended-graph Wiki · GitHub
Regarding the issue you’re describing, it could be part of the warning I tried to mention in the readme. Everything related to live synchronisation with you modifying settings or vault data (like modifying a file, renaming, etc.) can not exactly work. It really depends on the features you have enabled. Like I think the color issue might show up if you changed the shapes of the nodes, but shouldn’t be an issue otherwise.
You also need to understand how the states work. If you change the colors of the nodes, don’t save them in a new state, and then enable the plugin, you will load the “default state”. And the “default state” is… well, the default one, like the first time you create your vault (meaning without the colors). That is until you change its settings. So that could also be the issue, just a wrong usage of the plugin. If the wiki isn’t clear, let me know, but I tried to go in details with all the needed steps when you get started with the plugin and use it for the first time, including the state saving that I mentionned.
Yes, Juggl is a very cool plugin and lets you do plenty of stuff that my plugin doesn’t. It’s not built on top of the Obsidian core graph so it might also be more optimized, I have no idea. If you need text nodes in your vault, definitively go for juggl, as my plugin won’t offer that feature. The rest, I guess it will in general be kind of the same thing? I know it supports shapes, images, emojis, etc. I haven’t tried it really, but I guess it could be good to try it and see the differences so I can redirect people to the best plugin for their use case.
Anyways! Regarding your performance question, it will depends a lot on the features you choose to enable. If you’re loading images, or curved links, or probably shapes, don’t do that with thousands nodes. If you’re only going for the statistical features (to display nodes with different shapes/colors based on some computational function), I think it’s lighter. I need to do a proper benchmark to have an idea of the real impact of each feature. But definitively, I think this plugin is not suited for a really large vault with thousands of notes (unless you’re only using the “zoom to node” option for example).
I showcased an example of the worst thing I can do for now, since I don’t have a bigger vault than 600+ notes: Performances · ElsaTam/obsidian-extended-graph Wiki · GitHub
As you can see, it’s already showing performance issues for the initialization. Then it’s running smoothly enough. But I’m having all the heavy features enabled. Images, shapes, colored links, curved links, different size calculation, colors, etc. I’m actually never using them all.
thank you for the prompt reply, but i think it worked when i closed the graph view, another issue i’m facing is i want to color the links between the nodes, but it doesn’t work, as i downloaded data view, the only coloring i get is purple when i tried to follow the [friend:: [[Ruth Shaw]]] example, so i don’t know how to change the coloring basically. i want to colo
r the nodes, Performance and Schedule, if you can give an example on that it would be great, and also a way to format the color between them
And thanks for explaning what you’re trying to achieve. It helps me realize that the wiki is not complete
So yes, absolutely, you can color links. In order to be colored, a link has to have a type. That is, being used as a value of a property in the frontmatter, or as a value of an inline property with Dataview (like [friend:: [[Ruth Shaw]]] which will create a link of type friend toward Ruth Shaw’s node). You can change the coloring of the types in the Settings, under link. You either have a color palette that will automatically assign a color from the palette to each type (if you have 10 types, the palette is sampled in 10 points and it gives you 10 colors). Or you can also add “custom colors” to hand pick a color for a specific type (i.e. property), which will override the palette.
If you want to color the nodes, just use the core features of the graph, with the Groups tab.
If you need more details, I think I would need to have a better understanding of your vault’s structure (nodes, links, etc.).
Hey! this plugin is amazing! I made an account just to engage here. I have a question and suggestion.
I am unable to get colored links to work. Apparently you need a property? Can’t find any info about this on the wiki, and haven’t really engaged much with the data side of obsidian, however I found the “Color link by source” kinda does what I want.
I also have a suggestion! Transparent links. I tried to get this to work through a snippet but could never figure it out. When you highlight a node, it’s links will turn the color of your accent color and other links and nodes will become slightly transparent. I have a pretty big vault, so those link lines all crossing over one another really reveals where my vault pathways are like a neural pathway map. I was wondering if you could add this to the mod? Make an option so that all link lines are transparent, and we can control how transparent they are. Kinda like how you can already control link thickness, we could also control link transparency.
Anyway! I love this plugin, thank you so much for making it. I had been pretty regularly looking for a plugin that adds to the graph view but there doesn’t seem to be much of an interest in it. But your plugin is what I was looking for!
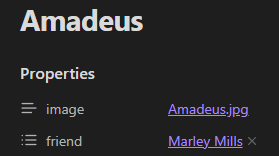
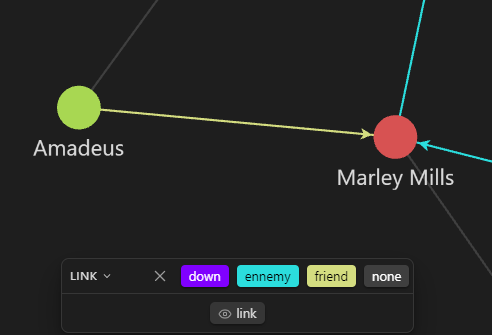
Regarding the link type, this is how it works. Your link has to be associated to a property, which will become its type in the graph view. For example, Amadeus and Marley are friends:
It would also work if you’re using Dataview and define your property like that: [friend:: [[Marley Mills]]]
Regarding the link transparency, I think what you’re describing is already a feature of the core graph plugin. Try this snippet:
.graph-view.color-line {
    opacity: 1;
}
But I think that’s the default, and they should already be opaque (as you can see in the above screenshot, the colored links seem opaque and they use the same opacity as the default links). So maybe the issue is that the link color is actually too close to the background color and you fill like it’s transparent? If then, try this snippet instead:
.graph-view.color-line {
    color: var(--color-base-50); /* 50 is closer to the text color (100) than to the background color (0)  */
    opacity: 1;
}
However if you would like to change the behavior of how the links fade out when a node is hovered (when they are not connected to it), then I’m afraid I didn’t quite understand exactly what you want (sorry, English is not my native language and I can miss some subtlety)
I’m messing with this plugin and I already know it is a keeper, thank you!
A suggestion, save settings:
The “Problem”(not really a problem)
As there are a bunch of settings, I find myself saving different configurations by making copies of the plugin folder.
Then, I can apply different configs by copy-pasting them or just feel safe experimenting, knowing that I can go back to a previous config without manually resetting every single thing I modified and possibly forgot about.
Also, a user could want to switch betewen different configs for different scenarios. I’m pretty sure I will. Think of it as saving workspaces like Photoshop does.
Solutions
Since this process is a bit laborious, it would be cool to be able to export and import settings as some other plugins do.
Or easier yet (for the user, not for the dev): being able to save different settings and switch between them on a drop list, without leaving Obsidian.
But this is just an idea, congratulations on this great tool and thanks again!
Hi!
Indeed, I’ve been thinking in adding the settings with the graph states but it would probably take too much things to change and I would need to refractor a lot of code.
But giving the opportunity to export settings and then load them from a dropdown can probably be done more easily, at the cost of reloading the graph when switching between different configurations.
I will add this to the features I need to add
Thanks!
In case you want to try it via BRAT, I’ve released it under the beta version 2.5.4
At the top of the Extended Graph Settings pane, you now have two buttons to import or export settings. The configurations are saved under .obsidian/plugins/extended-graph/configs/.