I’ve tried using a few different pages here to help but to no avail, so apologies if this does duplicate something I didn’t come across.
I want to be able to create a page per stock, and have a table tracking my transactions. I’d then like a dataview aggregate table that sums my current position. However I’ve been trying with the help of the forum (and Claude) and although I can “see” the stock page I return no results from it. Any ideas?
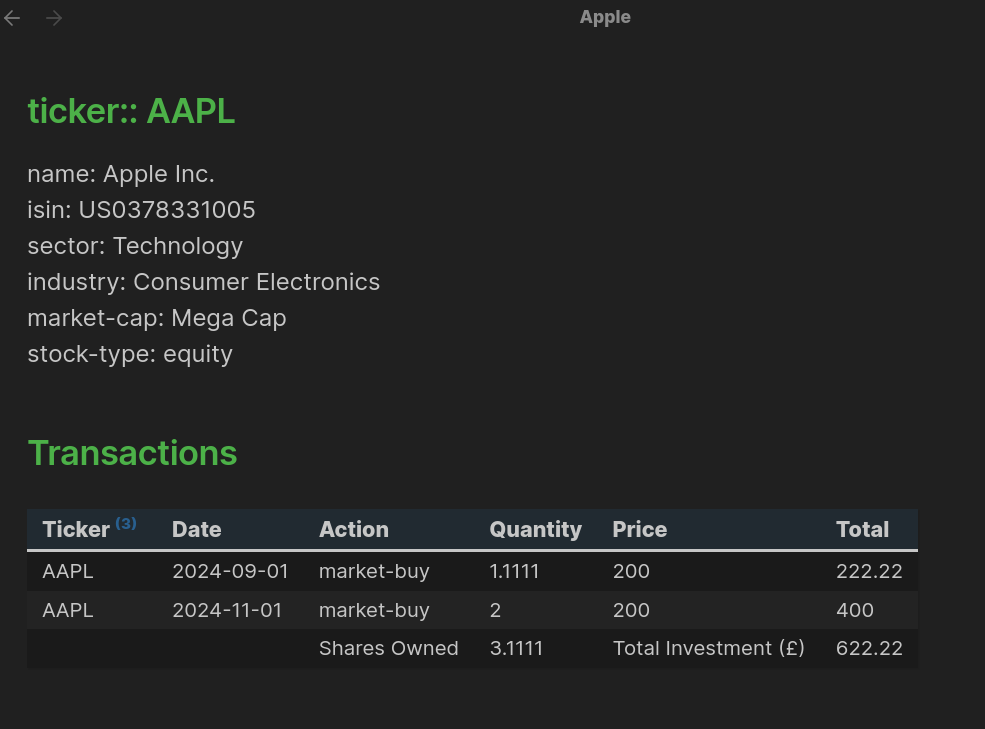
My stock page looks like:
ticker: AAPL
name: Apple Inc.
isin: US0378331005
sector: Technology
industry: Consumer Electronics
market-cap: Mega Cap
stock-type: equity
Transactions
Date
Action
Quantity
Price
Total
2024-09-01
market-buy
1
200
200
2024-11-01
market-buy
2
200
400
On a “Holdings” page (where I’d like to show that I have bought 3 shares for $600) I have tried a number of variations like this:
TABLE sum(rows.Quantity) as "Shares Owned",
sum(rows.Total) as "Total Investment (£)"
FROM "02 Areas of Responsibility/Investments"
FLATTEN file.tables as rows
WHERE ticker != null
GROUP BY ticker
It may be treating Total as a string and not a numeric value.
Might look at converting string to number (float / double).
To address this, you can use the number() function provided by Dataview to convert the Total field to a numeric type. Here’s how you can modify your query:
TABLE
sum(rows.Quantity) AS “Shares Owned”,
sum(number(rows.Total)) AS “Total Investment (£)”
FROM “02 Areas of Responsibility/Investments”
FLATTEN file.tables AS rows
WHERE ticker != null
GROUP BY ticker
I don’t know how to add numbers in obsidian but I do this in Numbers on the MAC and link the Numbers file to my obsidian vault. It works like a charm, so I can organize all kinds of spreadsheets and open them with one click from an obsidian note. On the MAC I use OPT+drag to drag a spreadsheet file onto a note and a uri link in Obsidian is created.
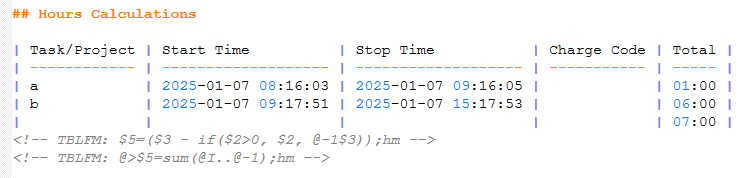
I can’t help the DV but I have a markdown table in my daily notes I use for tracking time on projects that does calculations and provides a total. It is manually triggered which is fine for me but the end result is that the md note has the data in it which can then be queried by DV. I suspect that DV can’t do the math part but again, clueless on my part.
Hours Calculations
Task/Project
Start Time
Stop Time
Charge Code
Total
a
2025-01-07 08:16:03
2025-01-07 09:16:05
01:00
b
2025-01-07 09:17:51
2025-01-07 15:17:53
06:00
07:00
I have hotkeys that add the current data/time into the field ALT + D and another that makes a total on a blank (key is it must be blank for my setup) row using ALT + F. As you can see in the image below the, the text is created in the md note meaning it can be queried like any other data.
The Dataview query isn’t doing what you think it’s doing. Dataview doesn’t have a native way to examine the contents of markdown tables. It wants to search for fields in either the YAML front matter
---
quantity: 1
price: 200
---
or inline fields within you note, like…
quantity:: 1
price:: 200
Your dataview query would make lots of sense if you stored all your transactions in one location or spread out in other notes like in your daily notes. Then you could query for those values and suck them into your specific stock note.
For example, lets say you have one note called “Holdings” that has all your transactions and uses inline fields. Notice there’s an Microsoft transaction as well. You would have all your purchases stored in here.
Then let’s say you have your Apple Note with its own inline field ticker:: AAPL (notice the double colon ::)
Apple Note
## ticker:: AAPL
name: Apple Inc.
isin: US0378331005
sector: Technology
industry: Consumer Electronics
market-cap: Mega Cap
stock-type: equity

## Transactions
```dataviewjs
// initialize stacks with objects whose "place" link to this location.
let result = await dv.query(`
TABLE WITHOUT ID I.ticker as Ticker, I.date as Date, I.action as Action, I.qty as Quantity, I.price as Price,
round((I.qty*I.price*100)/100,2) as Total
FROM "Holdings"
FLATTEN file.lists AS I
WHERE contains(I.ticker, this.ticker)
`);

if ( result.successful ) {
  const values = result.value.values;
  const numShares = values.map(v => v[3]) // <-- Column to sum
	.reduce((acc, tmp) => acc + tmp);
  const totalCost = values.map(v => v[5]) // <-- Column to sum
    .reduce((acc, tmp) => acc + parseFloat(tmp), 0.0);

  values.push(["","","Shares Owned",numShares,"Total Investment (£)",
    (Math.round(totalCost*100)/100).toFixed(2),
  ])

  dv.table(result.value.headers, values)
} else
  dv.paragraph("~~~~\n" + result.error + "\n~~~~")
```
I stole and modified the above Dataview code from @holroy. It behaves as follows…
It goes out the the Holdings note, looks for all list items that match the inline ticker field we used in the Apple note header, ticker:: AAPL.
Using the values returned from “Holdings”, it creates the Ticker, Date, Action, Quantity, and Price columns. It also calculates the Total column from the Quantity and Price
It then calculates the grand totals for the Quantity and Total
Another solution would be to use the Advanced Tables plugin and the formula capability it offers. The issue with this is that the formulas are cryptic at best, and require the reader to manually push a calculate button each time the table is modified. The upside is that your table is future proof since the resulting markdown table is static and no longer requires a plugin to display the results.
I created an example formula to calculate the Total column as well as a grand total…
Each markdown company specific file contains this table:
Transactions
Date
Action
Quantity
Price
Total
2024-12-02
(action::market-buy)
(quantity::0.01)
(price::182.80)
(total::1.92)
2024-12-24
(action::market-buy)
(quantity::0.01)
(price::178.50)
(total::1.92)
The solution was to use the [0] to index:
TABLE round(sum(rows.quantity[0]),3) as "Shares Owned",
round(sum(rows.total[0]), 2) as "Total Cost (£)"
FROM "02 Areas of Responsibility/Investments"
FLATTEN file.tables.rows AS rows
WHERE ticker != null
GROUP BY ticker
SORT sum(rows.total[0]) DESC
I would just like to point out a few shortcomings with that solution:
First of all the line FLATTEN file.tables.rows as rows does absolutely nothing, as there isn’t anything called file.tables as far as I know
I don’t quite get why you do the rows.quantity[0] thingy… It might relate to the strange data structure, but it looks kind of strange
When you define inline field like you do they are not really connected in any ways, so if you do a typo somewhere, you might risk skewing your entire data structure. I.e. if you write quantity: 1somewhere it’s not picked up, and will be used to calculate the cost alongside the next value
And you don’t really calculate anything in your query. Wasn’t the point to actually calculate the total for each market buy, in addition to calculating the overall total for any given ticker?
I do believe there are two really good solutions related to such a request, and that is either to use the Advanced tables plugin, or switching to a list context with inline fields, and then allowing for the fields to be connected in that list. Both exemplified by @FsOver2 earlier on.
Maybe sometime in the future we’ll get a plugin to actually read markdown tables, but as of now, they don’t exist in a stable state, AFAIK.
This is not an ideal solution and is underutilizing the full Obsidian features.
I would do it in a different way:
Each transaction has its own note, with their corresponding frontmatter or inline fields. The transaction note could be created with Templater, although a Modal would be perfect for entering the data. Each transaction note contains an index key to build the relationships, in this case the key is company, a frontmatter property or inline field.
A transactions summary Dataview table is then shown in the company page getting its data from every transaction note. The key is used to filter the notes that are part of the table.
A holdings summary Dataview table is also shown in the company page. Holdings getting its data from the transaction notes. Also here the key is used to filter the notes and build the table.
An improved version of this could be to have in the company page, summary tables per day, week, months, or year. An uuid based on the creation time would be used as a filtering mechanism. The uuid must be a hard value generated from the Templater script because the note creation time is not permanent. At least in Linux. I think MacOS keeps the creation time.