I have a Mermaid Gantt chart that plots correctly when hard coded start and end dates are used for a task.
I can substitute a variable for the start date.
If a variable is used for the end date, the bar fails to plot. The label and the rest of the chart display properly.
Steps to reproduce
- Set up a note with two user defined properties YearOpen and YearClose as date types with valid dates. Values I used given below.
- Modify line 25 (task 1 of section 1) of code below to see effect.
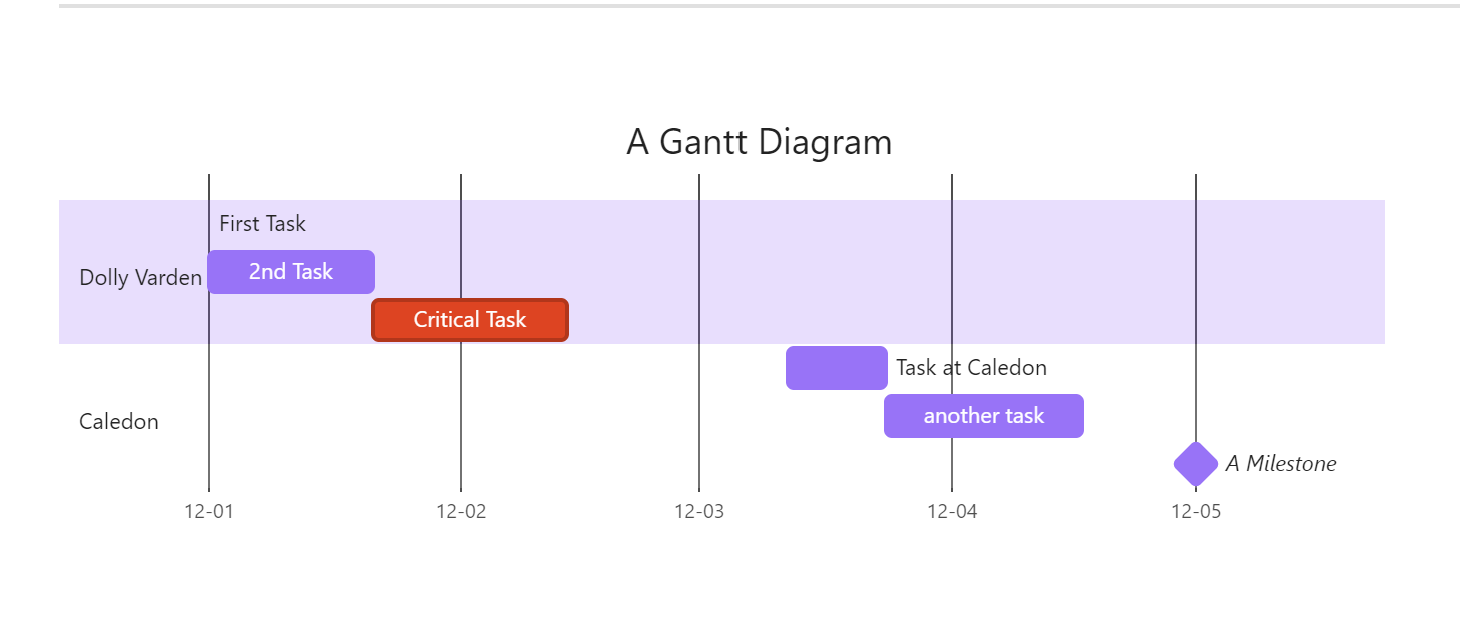
- Chart will plot properly using variable for start date of task. See first screenshot below.
- Change hard coded end date of 2012-03-02 to variable ${dClose}. Plot will not show bar. See second screenshot below.
- Revert both dates to hard code to confirm. Chart will plot properly.
//Section Names
const vS1 ="Dolly Varden"
const vS2 = "Caledon"

//Tasks
const vt1 = "First Task"
const vt2 = "2nd Task"
const vt3 = "Task at Caledon "
const vt4 = "A Milestone"

//Assign dates to variables.
//Pick up from a user defined property currently set to 2012-01-01
const dOpen= dv.current().YearOpen
//Pick up from a user defined property currently set to 2012-03-02
const dClose= dv.current().YearClose

dv.paragraph("```mermaid" +
    `\ngantt\n
     title A Gantt Diagram\n
     dateFormat YYYY-MM-DD\n
     tickInterval 1month
     axisFormat %y-%m
     section ${vS1}\n
        ${vt1}  :a1,${dOpen}, 2012-03-02\n
        ${vt2}  :after a1, 20d\n
        Critical Task    :crit, 24d
     section ${vS2}\n
        ${vt3} :2012-03-12, 12d\n
        another task    :24d\n
        ${vt4} :milestone, 2012-05-15\n`

     +"```"
)
Environment
SYSTEM INFO:
Obsidian version: v1.6.3
Installer version: v1.5.11
Operating system: Windows 10 Pro 10.0.22631
Login status: not logged in
Insider build toggle: off
Live preview: on
Base theme: adapt to system
Community theme: none
Snippets enabled: 0
Restricted mode: off
Plugins installed: 9
Plugins enabled: 2
1: Dataview v0.5.66
2: Mermaid Tools v1.1.3
Additional information
Gantt chart with correct display.

Gantt chart with missing task bar.