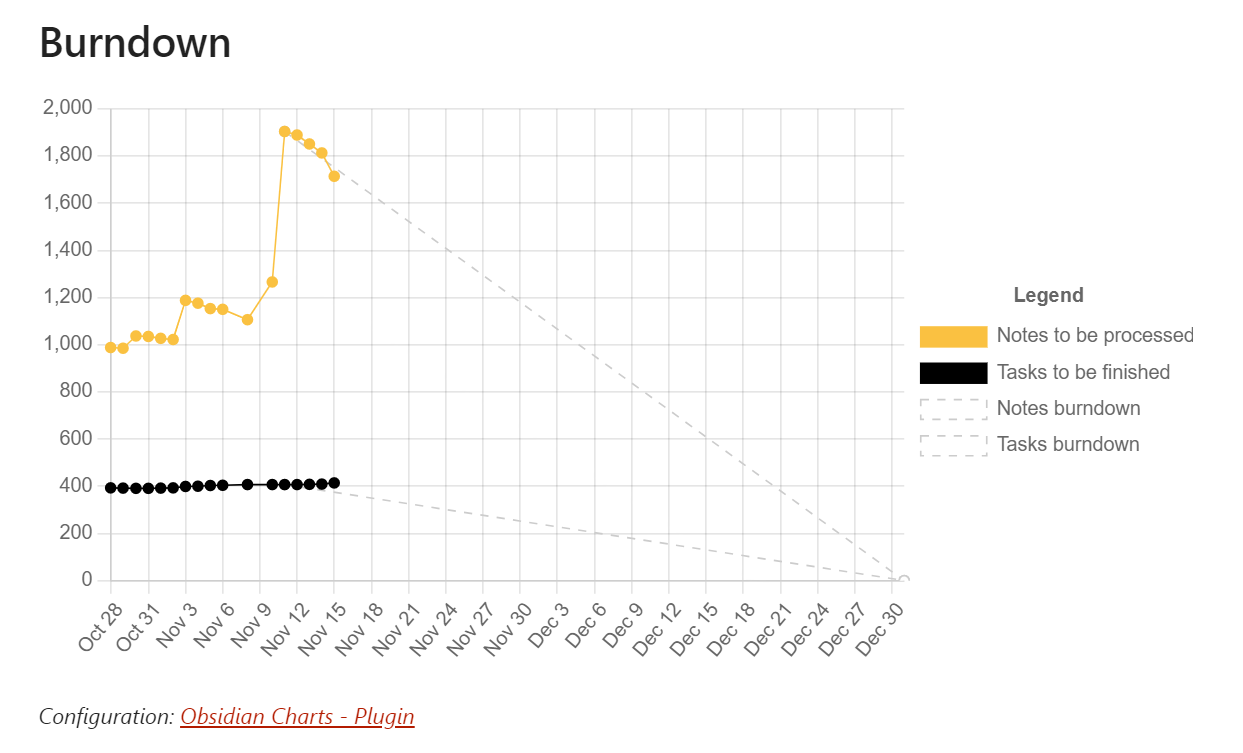
Sometimes charts are better than numbers. But my burndown chart [1] shows me what I’ve never expected: The work remaining is not only very high, it’s hard to prevent it from growing. ![]()
Any simple rule to adapt my process?
Reference
[1] Schwaber, Ken. Agile Project Management with Scrum. Microsoft Press, 2004, 11-12.