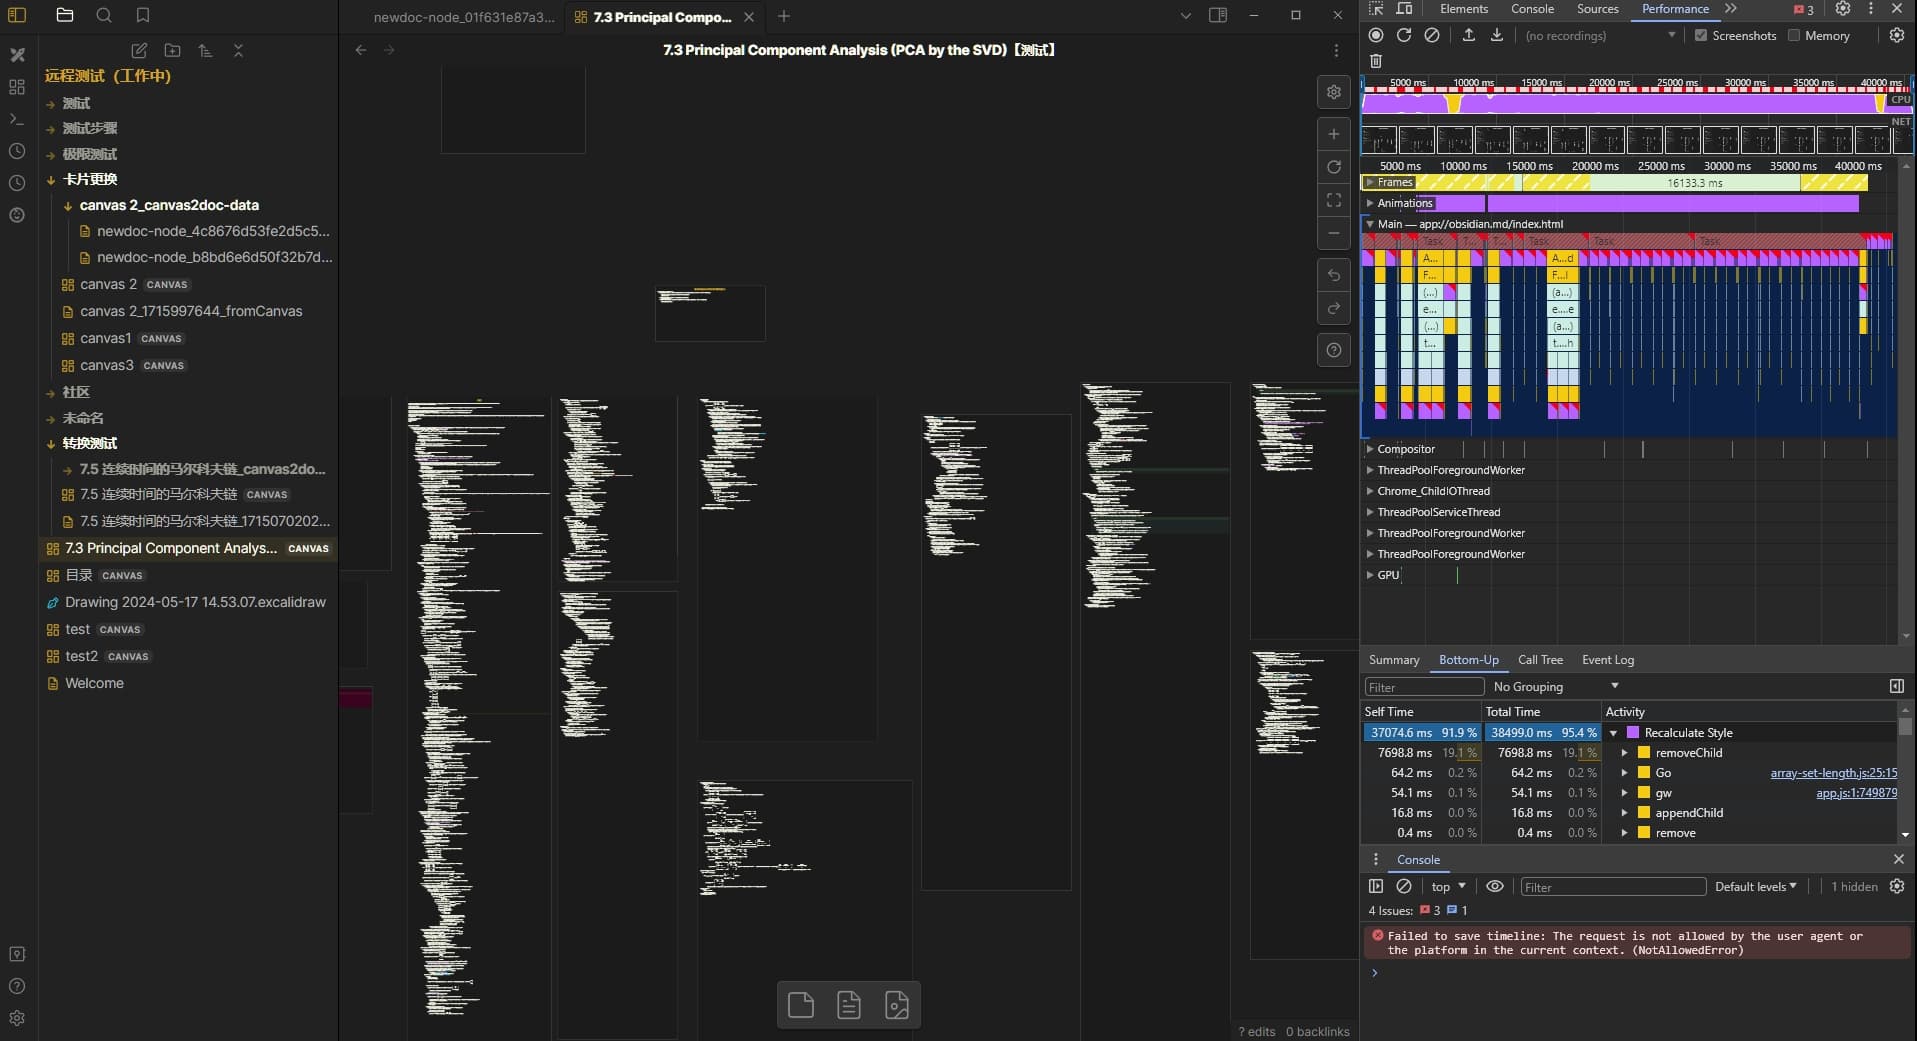
I think it’s related to the usage environment, as my cards contain a lot of text and LaTeX. Moreover, I’ve set the card display to the minimum limit. As you can see in the video above, enabling the CSS snippet causes window flickering, and it doesn’t change the CPU overload situation. I’m now trying to use the developer tools’ performance feature to detect more specific time usage. However, I’ve encountered an export issue and can’t export the report. ‘Failed to save timeline: The request is not allowed by the user agent or the platform in the current context. (NotAllowedError)’