Using Tag, Word & Link Cloud plugin
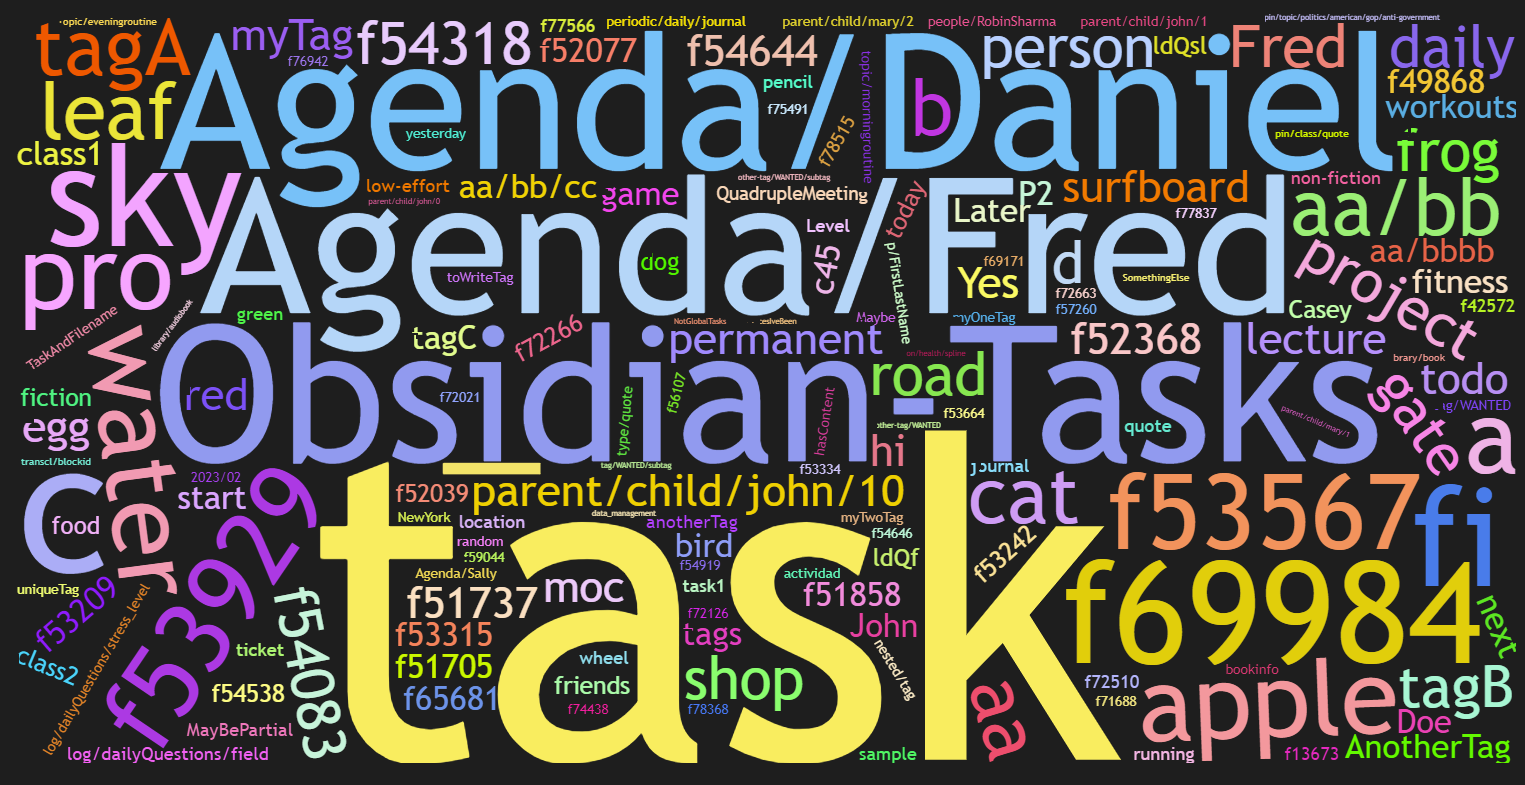
Have you tried the Tag, Word & Link Cloud plugin? With this configuration (on my test vault with 834 tags currently), it displayed the tag cloud below the configuration block:
```tagcloud
width: 1500
shape: square
maxDepth: 400
minCount: 2
minFontSize: 6
```
See GitHub - joethei/obsidian-tagcloud: Show a cloud of your tags/words/links in a note for documentation on the plugin.
MCL Multi Column
A more manual approach could be to manipulate the result from app.metadataCache.getTags(), possibly in combination with the MCL Multi Column.css snippet allowing for us to build multi-columns in our markdown.
Here is an example from my test vault with the first 60 tags:
```dataviewjs
const allTags = app.metadataCache.getTags()

dv.container.className += " multi-column-list-block"
dv.list(Object.keys(allTags).slice(0, 59))
```
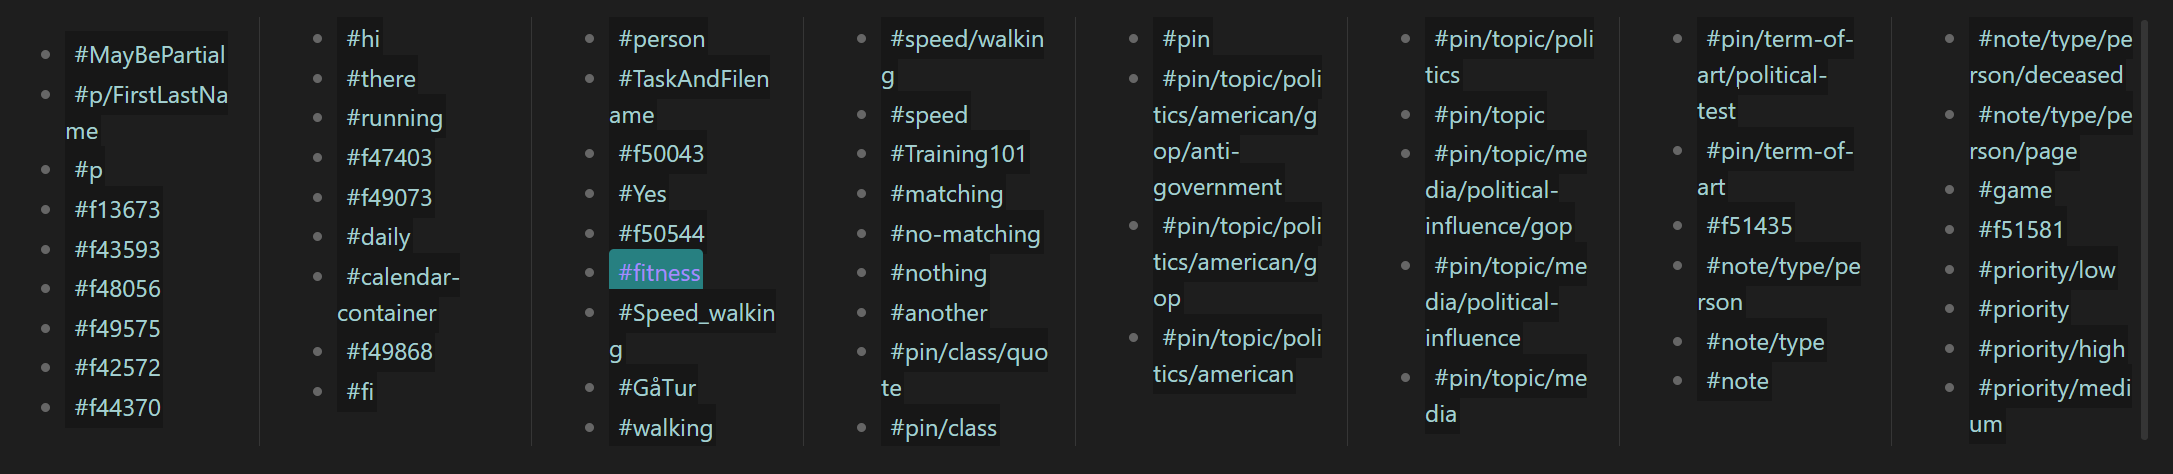
My test vault has 849 tags, so when I used this code like this with all 849 tags it stalled my laptop. I reckon it’s too heavy to do that kind of lifting using only CSS, as the multi column css class splits into multi columns. The output of the above query was for me:
See Multi Column | Modular CSS Layout for more on the MCL Multi Column css snippets.
Manual split in multiple columns
Still using the MCL Multi column, here is another variant which is better for Obsidian/Dataview to display:
```dataviewjs
// All tags sort by name
const allTags = Object.keys(app.metadataCache.getTags())
  .sort((a, b) => a.localeCompare(b))

const tagCount = allTags.length
// Define how many columns in a row
// and how many tags in each box
const colNum = 6
const rowCount = 30
const boxCount = Math.ceil(1.0 * tagCount / rowCount)
dv.header(2, "All tags")
dv.paragraph(`Tag count: ${ tagCount }`)

for (let i = 0; i <= Math.ceil(boxCount / colNum); i++) {
  let content = `\n---\n> [!multi-column]\n`
  for (let j = 0; j <= colNum; j++ ) {
    const start = i * colNum * rowCount + j*rowCount
    let end = start + rowCount -1
    if (end > tagCount) end = tagCount - 1
    if (start < tagCount) {
      content += `>\n>> [!info]- <small>${allTags[start].substring(1) } – ${ allTags[end].substring(1) }</small>\n`
      // content += `>\n>> [!info]- Tag ${start } -- ${ end }\n`
      for (const tag of allTags.slice(start, end)) {
        content += `>> - ${ tag }\n`
      }
    }
  }
  dv.el('div', content )
}

```
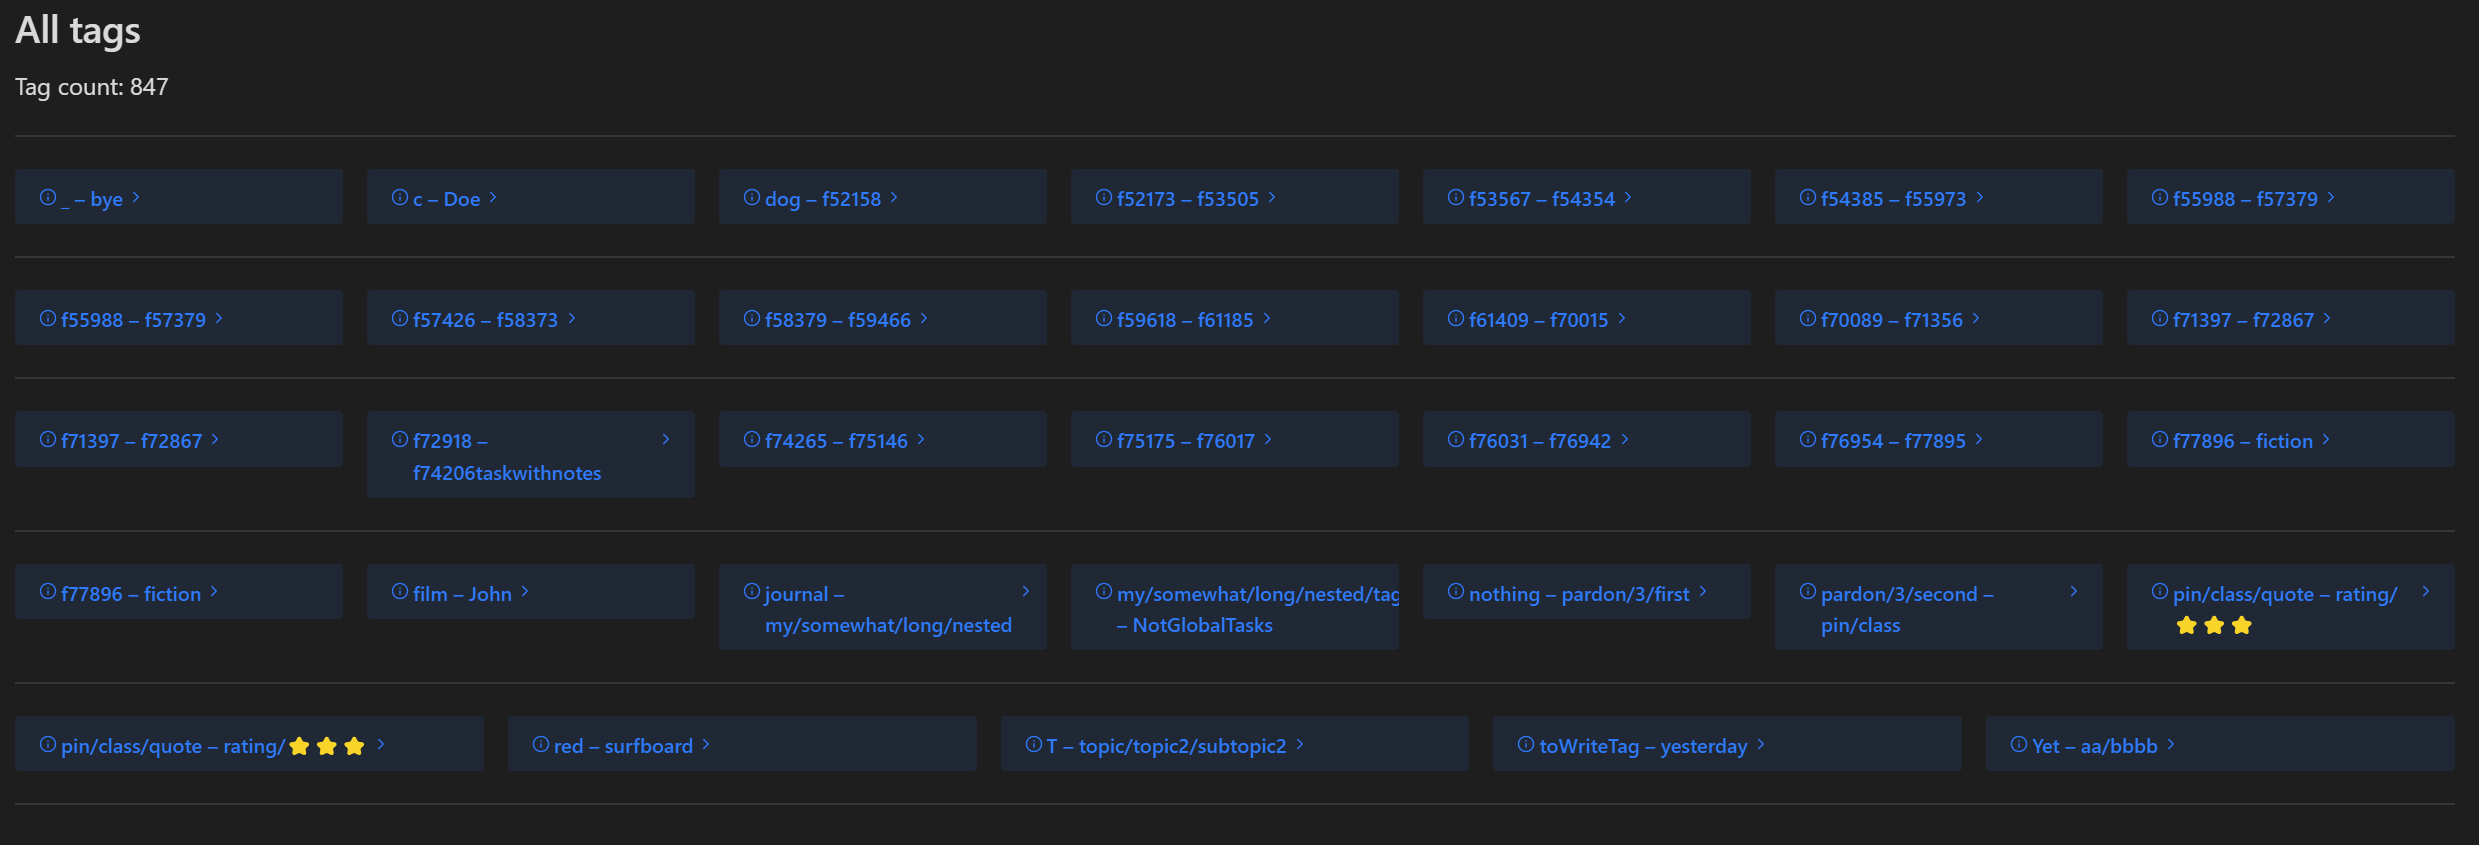
Note that if you make the boxes too large, you enter into a race condition with how much of the current note Obsidian keeps loaded, and this can make Obsidian seem to hang. With the settings above, and my 834 tags, this displays on a 24" (2560x1440) initially as:
Most likely, it’ll be better to filter out some of the tags before displaying them. And one could then consider not displaying tags having less than one occurence, or some criteria which make sense to you.
Manual split into multiple paragraphs
The last version I’m going to present is not dependent on using multiple columns, but it rather gathers the link together in paragraphs. In the image below I use highlighting to enhance what each paragraph contains, but you could switch to using headers, by changing the first line to false instead of true. Try it out, and see if you like either of these.
## Using paragraphs

```dataviewjs
// Change to false to use H4
const useHighlight = true

// All tags sort by name
const allTags = Object.keys(app.metadataCache.getTags())
  .sort((a, b) => a.localeCompare(b))

const tagCount = allTags.length
// Define how many tag in each paragraph
const eachParagraph = 80
const paragraphs = Math.ceil(1.0 * tagCount / eachParagraph)
dv.header(3, "All tags")
dv.paragraph(`Tag count: ${ tagCount }`)

for (let i = 0; i <= paragraphs; i++) {
  const start = i * eachParagraph
  let end = start + eachParagraph -1
  if (end > tagCount) end = tagCount - 1
  if (start < tagCount) {
    if (useHighlight) {
      dv.paragraph(`==${allTags[start].substring(1) } – ${ allTags[end].substring(1) }==: `  + allTags.slice(start, end).join(", "))
    } else  {
      dv.header(4, `${allTags[start].substring(1) } – ${ allTags[end].substring(1) }`)
      dv.paragraph(allTags.slice(start, end).join(", "))
    }
  }
}
```
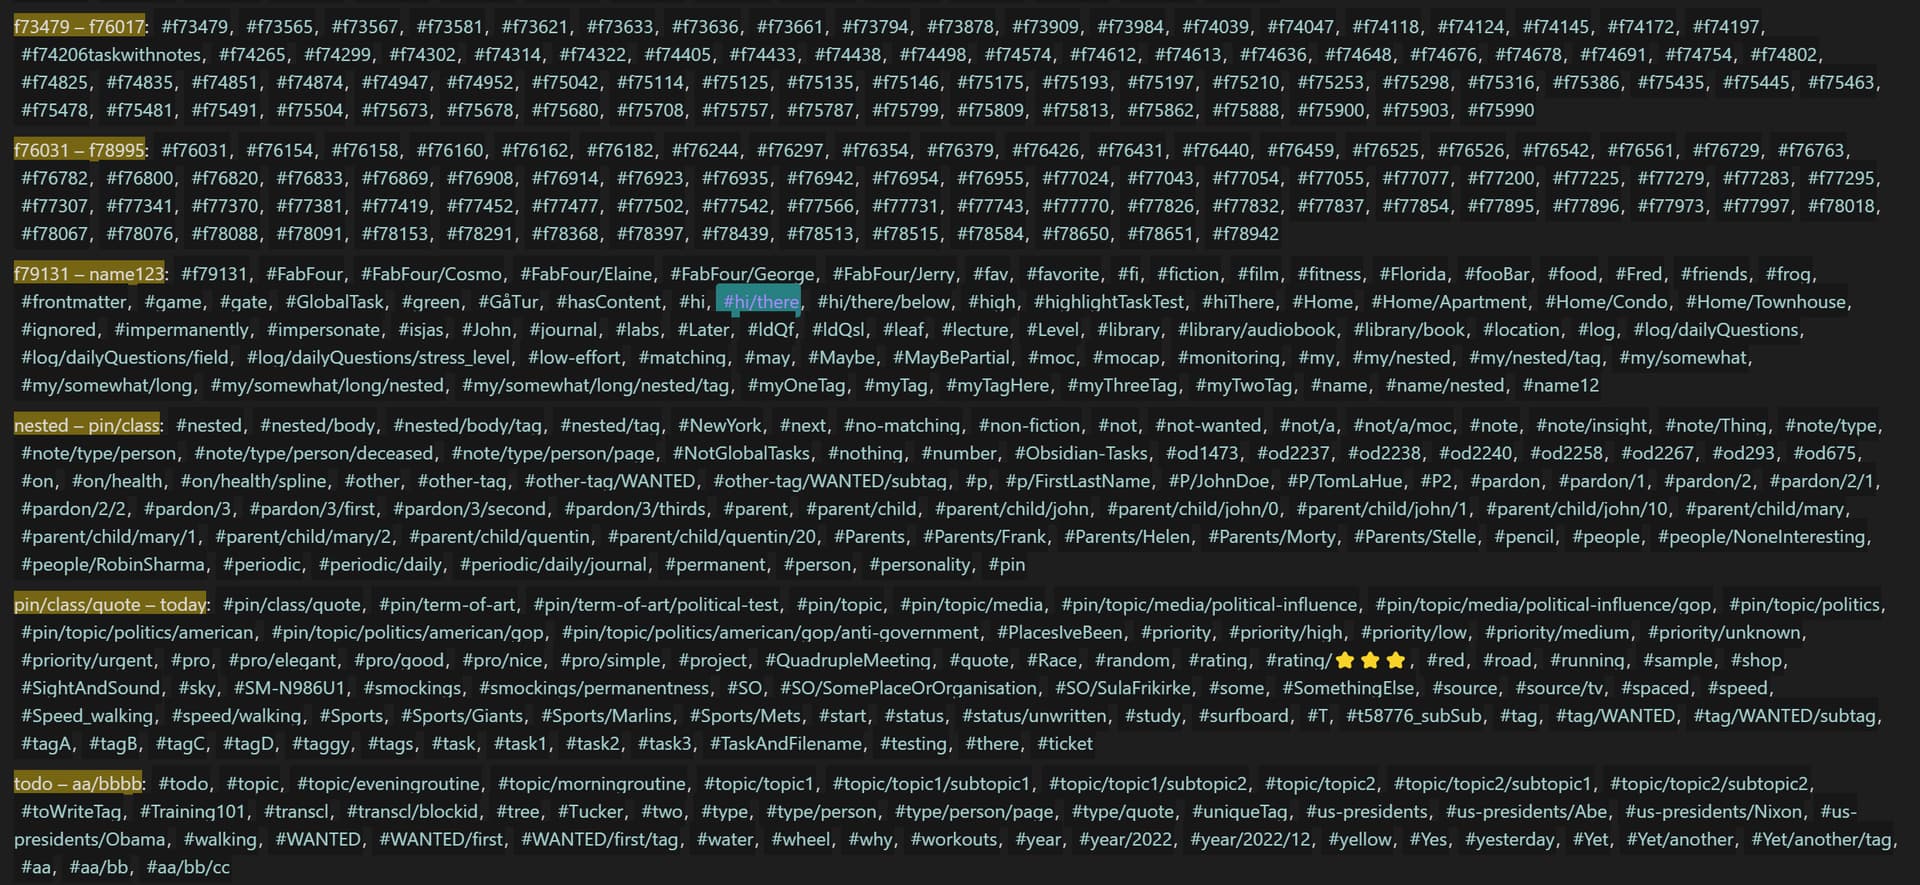
Where the end part displays like this for me:
Hopefully this should provide you with some alternatives as to how to fill your screen with tags! Note that I’ve deliberately left out the count on how many times the tags has been used, but that could be added back in if one would want to do so. Start out by changing the definition of allTags to not include only the Object.keys( ... ), and then modify the rest accordingly to display/sort/filter accordingly to having both a key with the tag name, and a value of the count.
(If you want to go down the path of including counts, I strongly suggest starting out with doing something like .slice(0, 99) on the initial set, so that you have a reasonable count of tags to work with before going larger)