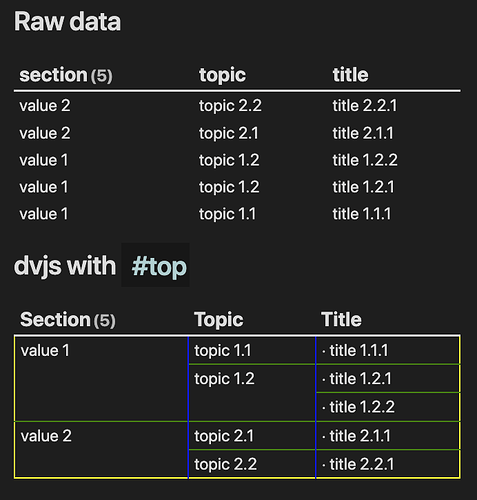
So after changing the row generation of your script to this:
            tableRows.push([
                firstLevel1 ? level1Value + ' #top' : "",
                firstLevel2 ? level2Value + ' #top' : "",
                `· ${page.title} #top`
            ]);
And adding this CSS as a snippet:
table tbody:has(a[href^="#top"]){
  border: 2px solid yellow;
  /* background-color: grey; /* */

  & td {
    border-right: 2px solid blue;
  }

  & td:has(a[href^="#top"]) {
    & a[href^="#top"] {
      display: none;
    }

    border-top: 2px solid green;
  }
}
I managed to produce this output in the default theme in dark mode:
As explained the simple gist of this idea is to hide all internal lines of the table (which is done by default in Obsidian), and then do the following changes as we go along:
- Each cell having content is marked with
#top - The entire
tbodyhas a yellow outline to mark the boundary of the data - Every
tdcell has a blue right border to define all columns - Hide the placeholder
#toptag - Only cells having the
#toptag have a green border at the top to signify a change of that value
Of course, you’d normally set all of these to the same color, but for the sake of the example and explanation I set these to different colors so you could better understand what’s happening. All in all, I do believe this is getting quite close to achieving the desired result.
The first table displays a default table from a Dataview query presenting the same data as your script processes in the second table.
I’ve not looked at optimising or changing other parts of your script (besides adding a little sorting), I just wanted to test this concept of adding just the necessary border lines as fast as I could… ![]()
