How to produce a dataview table consisting of a two-level Grouping?

I store notes in Obsidian which have various properties, the frontmatter looks like this:


level_1:
level_2:
title:

I’d like to produce a dataview table consisting of a two-level grouping, such that my data looks like the following (i.e. note Bar has level_1 = A, level_2 = B, and note Boz has level_1 = D):

Level 1 Level 2. Title


     A        B           Foo
                          Bar
                            
     D        E           Faz 

     F        c           Boz
              L           Sjk

I have seen a (small-ish) number of references online purporting to solve this, but cannot get any of them to give me what I want.

This is the sort of thing I’ve been trying, but it doesn’t group by l1 or l2 correctly (only one l1 is shown and all l2s are show whether or not they ought to be hidden):

TABLE without id 
    level_1 as "Level 1", 
    rows.rows.level_2 as "Level 2",
    rows.rows.date,
    link(rows.rows.Title, Title) as Title
GROUP BY "Level 2"
GROUP BY rows.level_1[0]

Can you write a dataview query to give me what I want?

Standard Dataview queries is somewhat icky when it comes to trying to combine/collapse multiple rows into one. However, doing the simpler grouping on a combination of key features is easier. So I’d try something like

```dataview
TABLE WITHOUT ID level_1, level_2, title
SORT level_1, level_2
```

Or you could do GROUP BY [level_1, level_2] in something like:

```dataview
TABLE key[0] as "Level 1", key[1] as "Level 2", length(rows) as "Count"), rows.title as "Titles"
GROUP BY [level_1, level_2]
```

The second query is the closest to what I want, but when there are two different values in level 2 for a single value in level 1, the query duplicates the value in level 1 to display each value in level 2 separately as follows:

 A       B          Foo 
                        
 F       E          Faz 

 F       L          Boz

Is there a way to prevent this from happening?

Not really, since dataview is not good at collapsing rows. There are heavily code reliant ways of doing it, but they do require some slightly finicky coding to achieve that result. So in most cases, I’d suggest just living with seeing the repeated values.

Hi holroy,
I dived a little deeper and created this dataview js query, which is the closest I’ve come to what I want, and this is the query:

// Define the grouping levels
const level1 = "Section";
const level2 = "Topic";

// Get all pages with the required fields
const pages = dv.pages().where(p => p[level1] && p[level2] && p.title).array();

// Group by the first level
const groupedByLevel1 = pages.reduce((acc, page) => {
    const key = page[level1];
    if (!acc[key]) acc[key] = [];
    acc[key].push(page);
    return acc;
}, {});

// Create an array to hold the table rows
let tableRows = [];

// Iterate over the first level groups
for (const [level1Value, level1Group] of Object.entries(groupedByLevel1)) {
    // Group by the second level within each first level group
    const groupedByLevel2 = level1Group.reduce((acc, page) => {
        const key = page[level2];
        if (!acc[key]) acc[key] = [];
        acc[key].push(page);
        return acc;
    }, {});

    // Iterate over the second level groups
    let firstLevel1 = true;
    for (const [level2Value, level2Group] of Object.entries(groupedByLevel2)) {
        let firstLevel2 = true;
        for (const page of level2Group) {
            tableRows.push([
                firstLevel1 ? level1Value : "",
                firstLevel2 ? level2Value : "",
                `· ${page.title}`
            ]);
            firstLevel1 = false;
            firstLevel2 = false;
        }
        firstLevel2 = true; // Reset for the next group
    }
    firstLevel1 = true; // Reset for the next group
}

// Display the table
dv.table(["Section", "Topic", "Title"], tableRows);

and this is the result:

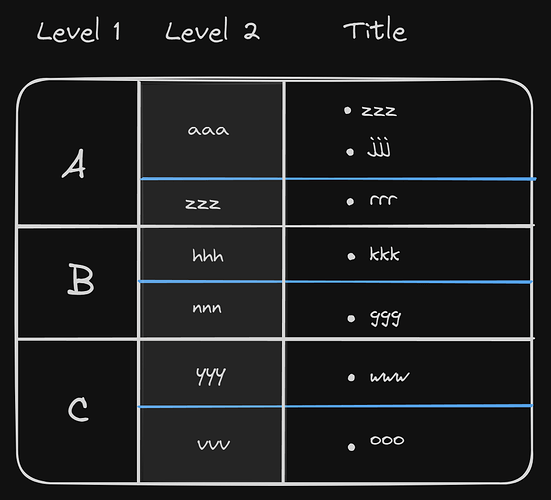
One question I have is whether a single row in the table can contain several separate values, each in a separate field after grouping duplicate values instead of showing empty fields as I did in the previous code, such as row ‘A ’ in this screenshot.

or can this not be done, and if it can be done, can you give me some information about this?

This is normally done the other way around, that is that you set a rowspan attribute of the first column according to how many rows you’ll have later on. So for your drawn example you would set rowspan=3 for the A cell, and rowspan=2 for the aaa cell, and rowspan=2 for the C cell. Sadly, this can’t be done easily using just markdown tables and/or dataview. You’d need to access the HTML tables to set this attribute.

I’ve been contemplating on extending (or rather suggesting an extension to) Dataview to allow for this kind of grouping behavior, but I’ve not had the time or energy to code this, and it would require some coding.


A workaround could be to format your tables without internal lines, and then use color schemes to change the various boxes according to your groups. Or maybe a simple variant could be to remove all internal lines, and for each cell you actually add a value you also add a tag which re-inserts the line above that value. This should possibly do the trick…

Hmm… I might take a stab at providing such CSS later on tonight, if I get around to it.

1 Like

So after changing the row generation of your script to this:

            tableRows.push([
                firstLevel1 ? level1Value + ' #top' : "",
                firstLevel2 ? level2Value + ' #top' : "",
                `· ${page.title} #top`
            ]);

And adding this CSS as a snippet:


table tbody:has(a[href^="#top"]){
  border: 2px solid yellow;
  /* background-color: grey; /* */
  
  & td {
    border-right: 2px solid blue;
  }
  
  & td:has(a[href^="#top"]) {
    & a[href^="#top"] {
      display: none;
    }

    border-top: 2px solid green;
  }
}

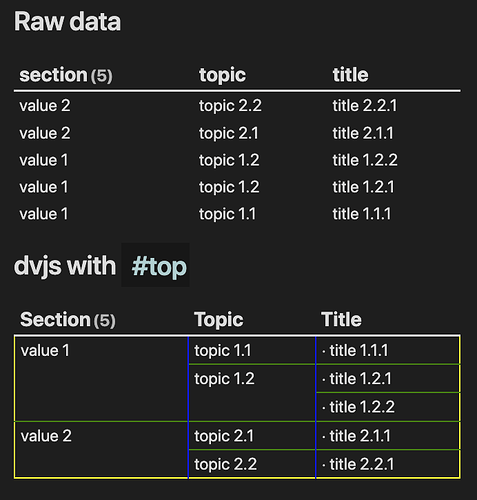
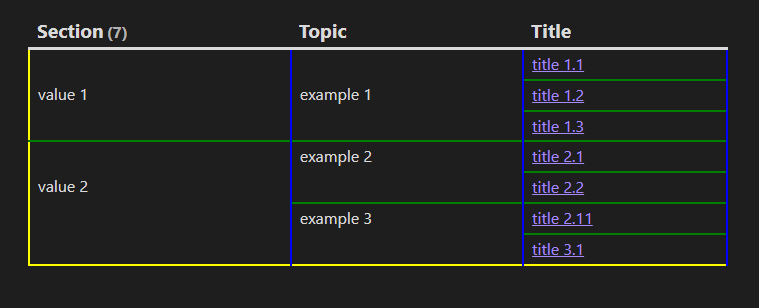
I managed to produce this output in the default theme in dark mode:

As explained the simple gist of this idea is to hide all internal lines of the table (which is done by default in Obsidian), and then do the following changes as we go along:

  • Each cell having content is marked with #top
  • The entire tbody has a yellow outline to mark the boundary of the data
  • Every td cell has a blue right border to define all columns
  • Hide the placeholder #top tag
  • Only cells having the #top tag have a green border at the top to signify a change of that value

Of course, you’d normally set all of these to the same color, but for the sake of the example and explanation I set these to different colors so you could better understand what’s happening. All in all, I do believe this is getting quite close to achieving the desired result.

The first table displays a default table from a Dataview query presenting the same data as your script processes in the second table.

I’ve not looked at optimising or changing other parts of your script (besides adding a little sorting), I just wanted to test this concept of adding just the necessary border lines as fast as I could… :slight_smile:

1 Like

I just love responding to myself… Ooopss…

Here is a slightly modified version of the script which just loops the table once. Compared to your script the logic has shifted slightly into the following:

  • Do the query collating the data
  • Sort it correctly according to the levels of your choice
  • Map out the interesting values
  • Loop the entire table row by row, adding the flag or clearing out if the value on the same level is equal to the previous. This scheme could be extended to even more levels if one would like to do so…
  • Display the table
```dataviewjs
// Define the grouping levels
const level1 = "Section";
const level2 = "Topic";

// Get all pages with the required fields in the correct sorted order
const tableRows = dv
  .pages()
  .where(p => p[level1] && p[level2] && p.title)
  .sort(p => [p[level1], p[level1], p.title].join("/"))
  //.sort(p => p.title)
  .map(p => [ p[level1], p[level2], p.title])
  .array();

// Loop the table, setting the flag, or clearing the value as one sees fit
let firstCol = ""
let secondCol = ""

for (const row of tableRows) {
  console.log(firstCol, secondCol, row)
  if (firstCol == "" || firstCol !== row[0]) {
    firstCol = row[0]
    row[0] = row[0] + " #top"
    secondCol = ""
  } else 
    row[0] = ""
  
  if (secondCol == "" || secondCol !== row[1]) {
    secondCol = row[1]
    row[1] = row[1] + " #top"
  } else 
    row[1] = ""

  row[2] = row[2] + " #top"
}
  
// Display the table
dv.table(["Section", "Topic", "Title"], tableRows);
```

Is this a better solution than yours? Who knows, at least it only loops the table once since we’ve already made sure that the rows in the table are in the correct order.

1 Like

Hi holroy
Sorry for the delay in replying, I tried what you did in the last message but it didn’t show any result.
Did you do something else that you didn’t explain?

You did add the CSS snippet? Both posts rely on that

table tbody:has(a[href^="#top"]){
    border: 2px solid yellow;
    /* background-color: grey; /* */
    
    & td {
      border-right: 2px solid blue;
    }
    
    & td:has(a[href^="#top"]) {
      & a[href^="#top"] {
        display: none;
      }
  
      border-top: 2px solid green;
    }
  }

Yes, as shown in the video
At first I tried the snippet in the basic vault but it didn’t work, I said maybe because of the theme but I put everything in the demo vault with no result, is there something you did that you didn’t mention?

After several attempts to see where the issue was in the snippets, I changed the name of the snippet and added it to the snippet and it worked :slightly_smiling_face:

.grouped-levels table tbody:has(a[href^="#explain"]){
    border: 2px solid yellow;
    /* background-color: grey; /* */
    
    & td {
      border-right: 2px solid blue;
    }
    
    & td:has(a[href^="#explain"]) {
      & a[href^="#explain"] {
        display: none;
      }
  
      border-top: 2px solid green;
    }
  }

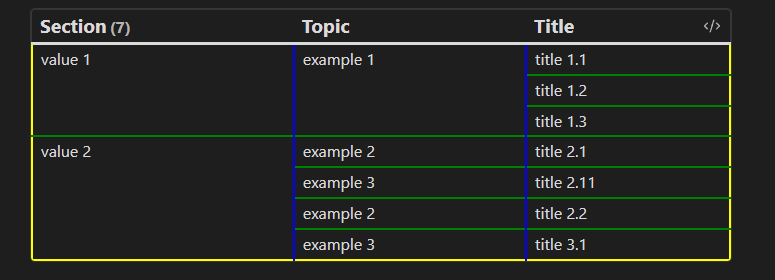
Apart from the fact that the order in your table is inaccurate and problematic, it only works if the values are ordered in descending or ascending order in the title column for each of the values in level 2, as shown here:

Also, regardless of the fact that my table and your table all the values in them that are in level 1 and level 2 appear in the first row as well as not in the middle of the results, and this is an optimization that I want to apply, but when doing this optimization, your snippet will definitely not work well, so I modified the dataviewjs query to make the values in level one and two centralize the results by using a new concept and fixing the aforementioned order issue and came up with this:

The Table

```dataviewjs
const level1 = "Section";
const level2 = "Topic";

const tableRows = dv
  .pages()
  .where(p => p[level1] && p[level2] && p.title)
  .sort(p => [p[level1], p[level2], p.title].join("/"))
  .map(p => [p[level1], p[level2], `[[${p.title}]]`])
  .array();

let firstCol = "";
let secondCol = "";
let firstColCount = 0;
let secondColCount = 0;
let firstColMiddleIndex = 0;
let secondColMiddleIndex = 0;
let firstColStartIndex = 0;
let secondColStartIndex = 0;

for (let i = 0; i < tableRows.length; i++) {
  const row = tableRows[i];

  if (firstCol !== row[0]) {
    firstCol = row[0];
    firstColStartIndex = i;
    firstColCount = tableRows.filter(r => r[0] === firstCol).length;
    firstColMiddleIndex = firstColStartIndex + Math.floor((firstColCount - 1) / 2);
    secondCol = "";
    if (i !== firstColMiddleIndex) {
      row[0] = `<span class="highlight">#line</span>`;
    } else {
      row[0] = `<span class="highlight">${firstCol} #line</span>`;
    }
  } else if (i === firstColMiddleIndex) {
    row[0] = `<span class="highlight">${firstCol}</span>`;
  } else {
    row[0] = "";
  }

  if (secondCol !== row[1]) {
    secondCol = row[1];
    secondColStartIndex = i;
    secondColCount = tableRows.filter(r => r[1] === secondCol).length;
    secondColMiddleIndex = secondColStartIndex + Math.floor((secondColCount - 1) / 2);
    if (i !== secondColMiddleIndex) {
      row[1] = `<span class="highlight">#line</span>`;
    } else {
      row[1] = `<span class="highlight">${secondCol} #line</span>`;
    }
  } else if (i === secondColMiddleIndex) {
    row[1] = `<span class="highlight">${secondCol}</span>`;
  } else {
    row[1] = "";
  }

  row[2] = `<span class="highlight">${row[2]} #line</span>`;
}

// Display the table
dv.table(["Section", "Topic", "Title"], tableRows);
dv.container.classList.add("grouped-levels");

The table simply checks the value that is in the middle of the results in levels 1 and 2 and sees if this value is in the first row in its part (the part in which the value is repeated) in the table or if it is in another row in its part in the table. If it is in the first row, the table writes #line next to the value. If the value is not in the first row, the table writes #line in the first row without writing the value next to it, as shown here:

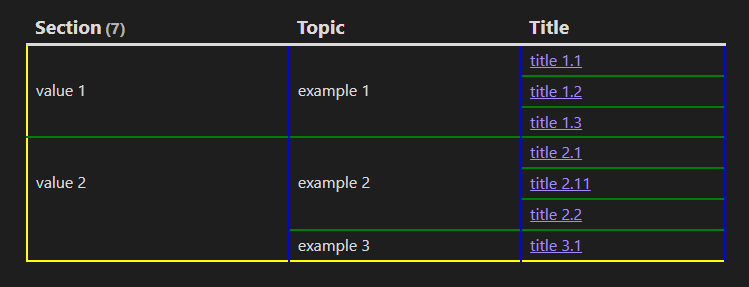
With this we can use your snippet (replacing #top with #line) and this will be the result

It also solves the above mentioned sorting issue , as shown here:

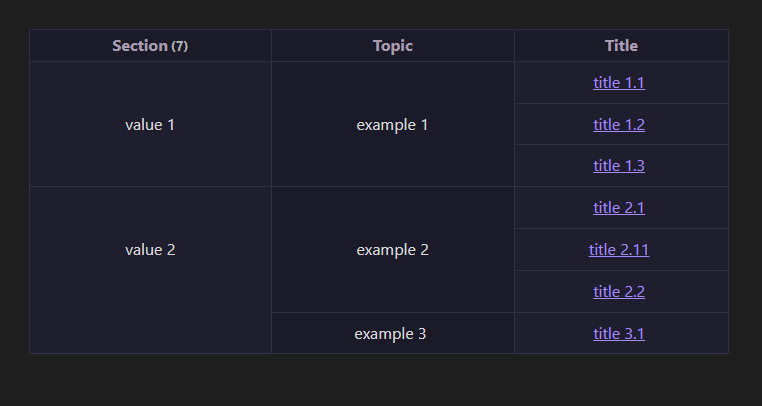
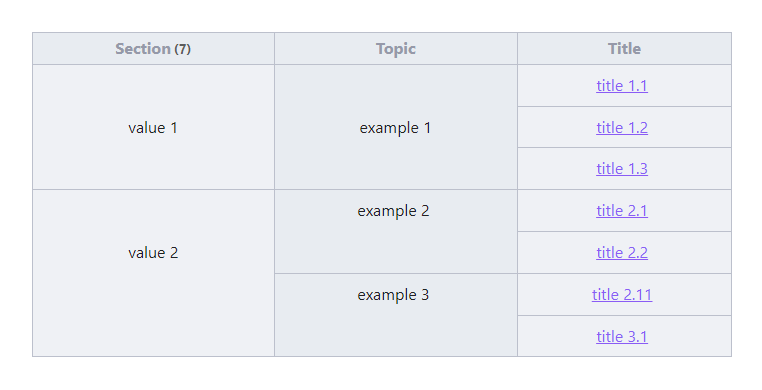
And after modifying your snippet and adding some styling to it , this is the final result:

The Snippet

.theme-dark .grouped-levels table tbody:has(a[href^="#line"]) {
  border: 1px solid rgba(49,50,68,255);
  
  & td {
    border-right: 1px solid rgba(49,50,68,255);
    text-align: center;
    vertical-align: middle;
    padding: 10px;
  }
  
  & td:has(a[href^="#line"]) {
    & a[href^="#line"] {
      display: none;
    }

    border-top: 1px solid rgba(49,50,68,255);
  }
}

.theme-dark .grouped-levels table thead th {
  padding: 5px 10px;
  background-color: #1B1A29 !important;
  border-bottom: 1px solid #302D41;
  border-top: 1px solid #302D41;
  border-left: 1px solid #302D41;
  border-right: 1px solid #302D41;
  text-align: center;
  color: #A79CB0;
  font-size: 16px;
}

.theme-dark.grouped-levels td,
.theme-dark.grouped-levels th {
  border: 1px solid #302D41;
  padding: 4px 4px;
  border-left: 1px solid #302D41;
  border-right: 1px solid #302D41;
}

.theme-dark .grouped-levels table tbody td:nth-child(odd) {
  background-color: #1E1E2E;
}

.theme-dark .grouped-levels table tbody td:nth-child(even) {
  background-color: #1B1A29;
}

.theme-light .grouped-levels table tbody:has(a[href^="#line"]) {
  border: 1px solid #BCC0CC;
  
  & td {
    border-right: 1px solid #BCC0CC;
    text-align: center;
    vertical-align: middle;
    padding: 10px;
  }
  
  & td:has(a[href^="#line"]) {
    & a[href^="#line"] {
      display: none;
    }

    border-top: 1px solid #BCC0CC ;
  }
}

.theme-light .grouped-levels table thead th {
  padding: 5px 10px;
  background-color: #E8ECF1 !important;
  border-bottom: 1px solid #BCC0CC;
  border-top: 1px solid #BCC0CC;
  border-left: 1px solid #BCC0CC;
  border-right: 1px solid #BCC0CC;
  text-align: center;
  color: #9599A9;
  font-size: 16px;
}

.theme-light.grouped-levels td,
.theme-light.grouped-levels th {
  border: 1px solid #BCC0CC;
  padding: 4px 4px;
  border-left: 1px solid #BCC0CC;
  border-right: 1px solid #BCC0CC;
}

.theme-light .grouped-levels table tbody td:nth-child(odd) {
  background-color: #EFF1F5;
}

.theme-light .grouped-levels table tbody td:nth-child(even) {
  background-color: #E8ECF1;
}

The final output:


Edit : If anyone wants to hide the number beside level 1 (in this case section),
Add this to the snippet.

.dataview.small-text {
  display: none;
}

Anyway, thanks for your great idea :sparkles:

1 Like