I saw BenCodeZen debugging some snippet of Javascript code he wrote in a dataviewjs section. Doing this he opened the “developer tools”. But I don’t understand how to manage this in Obsidian under Windows. I can’t find any feature in the settings doing this. Can you help me?
1 Like
The Developer Tools can be opened on windows with the shortcut:
Ctrl + Shift + I
2 Likes
Thank you. Next time I will ask earlier ![]()
Some more context for others finding this: Obsidian is made using Electron, basically the Chrome browser. And because it’s a browser we can use Chrome’s Developer tools to debug Obsidian.
More information about the Chrome Dev Tools: Chrome DevTools - Chrome Developers
Hi,
I am very interested in learning how to debug JavaScript snippets of DataviewJS or Templater, but I am not sure how to get started. While I have some beginner knowledge of JavaScript, I have no experience with the console.
Here are my questions:
- Do you have any tips on how to get started?
- When I look at the Obsidian console, I see error messages like this:
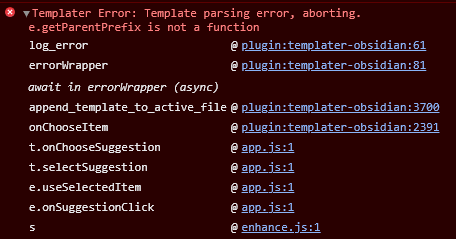
but I don’t understand them. - Is it possible to set breakpoints in a Templater or DataviewJS snippet? With this, I could at least identify the location where the code has an error.
Thank you in advance,
Silias
1 Like
This seems useful: How to debug Obsidian plugins – mnaoumov.NET
2 Likes
This seems useful: How to debug Obsidian plugins – mnaoumov.NET
Unfortunately not (if I understand correctly). Your article describes how to inspect the code of a plugin itself, not code written in Obsidian code blocks.
Any chance could share the video (and time in the video) where you saw this?
With Templater you can write debugger; on a line in an execution command to trigger a breakpoint in the “sources” tab in the dev tools. For example:
<%*
const text = await tp.system.prompt("Text");
debugger;
// More code...
-%>
Once the debugger triggers the code to stop, you can interact with the “sources” tab in dev tools as normal.
I’m sure you can do the same thing with DataviewJS.