First, search the help docs and this forum. Maybe your question has been answered! The debugging steps can help, too. Still stuck? Delete this line and proceed.

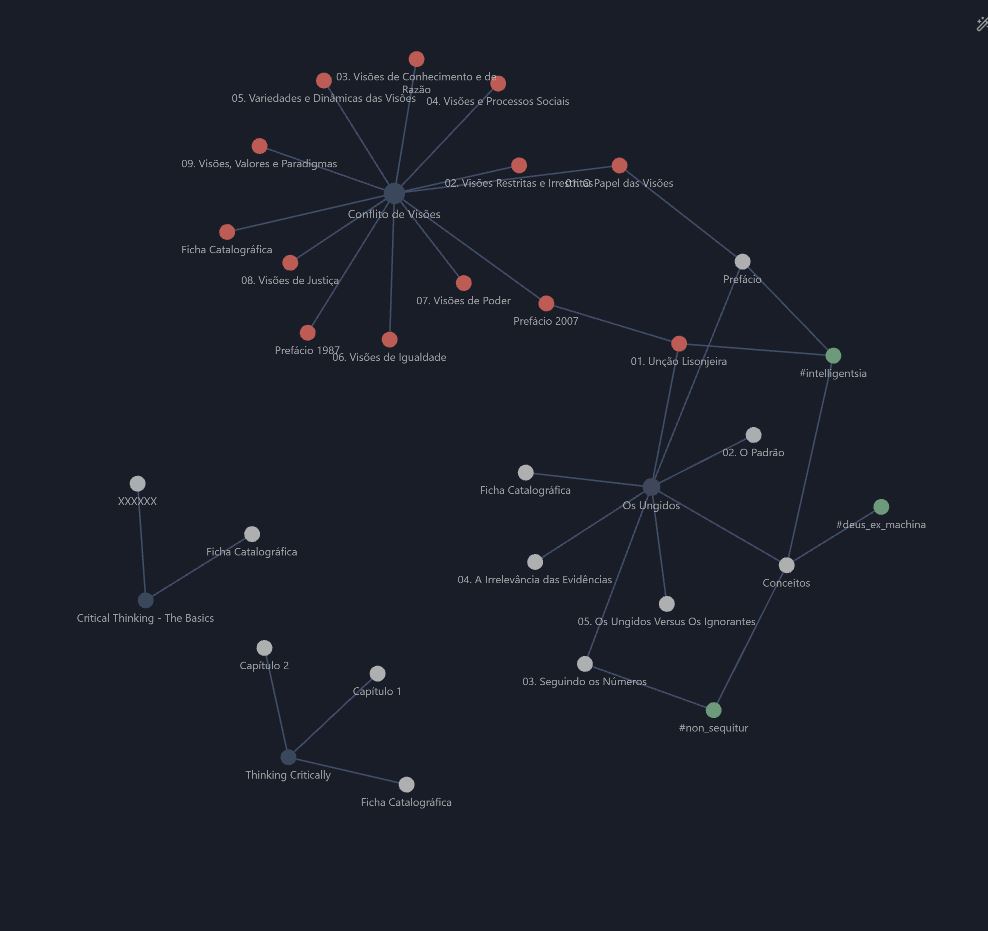
Folders don’t have nodes in the graph, only files. You can create Sowell and Critical Thinking notes (or other files with their names) to have them show up in the graph.
Alternatively, there might be plugins let you show folders in the graph. (I don’t have experience with any.)
Hi dawni:
Thank you so much! Your suggestions help me a lot.
Best regards,
Zique.