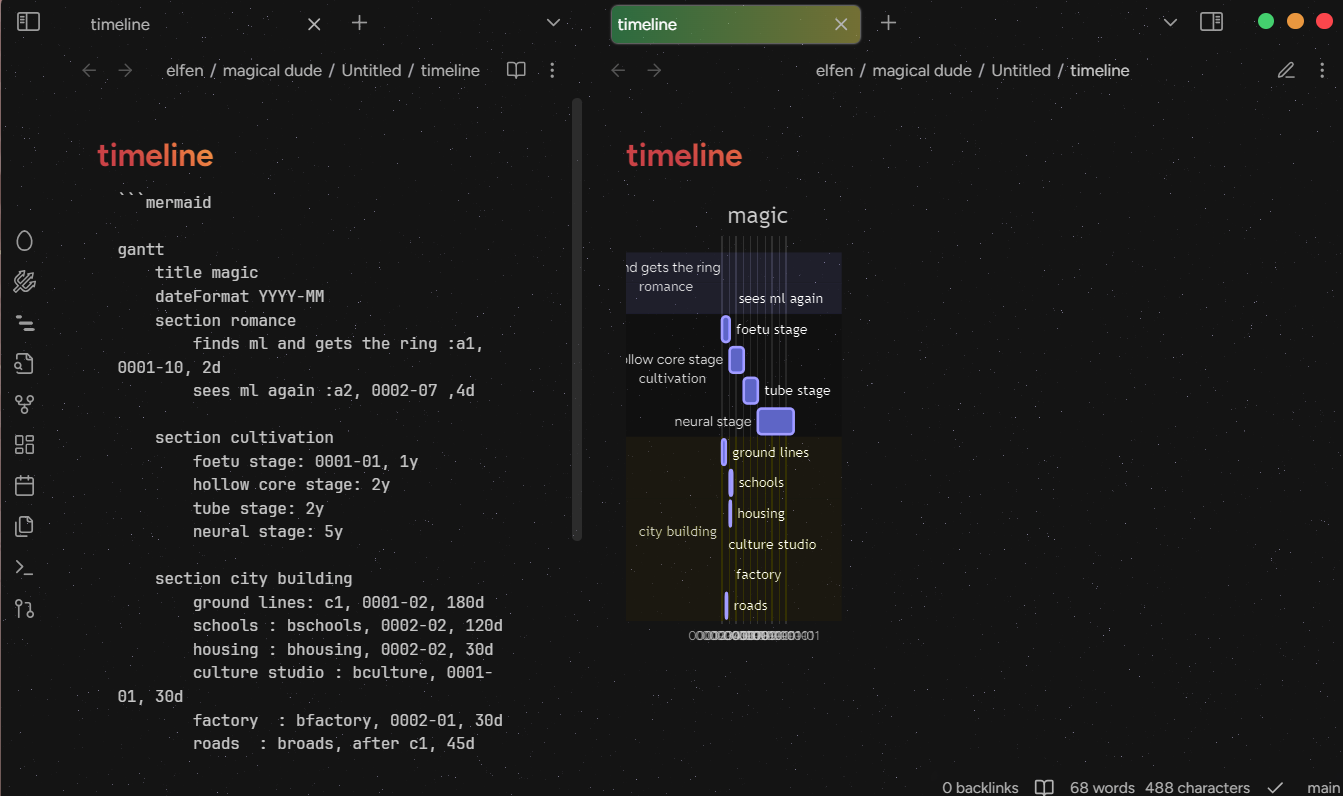
So I’m writing a book using obsidian as a text editor for a variety of reasons, and it’s going great, but I want to make a timeline using a gannt chart to organize the pacing for the novel. It’s doing okay, but I cannot for the life of me find out how to just make the graph wider. Basically, I want 1 day to be a box10 pixels long, but a day is .3 pixels or something and a ten year period is in a tiny chart.
Things I have tried
I’ve tried making a css file for the graph. I was sucessfully able to make it bigger on rendering the image, but I haven’t been able to make the data wider. the graph is just zooming in or centerring, but one day events do not show up.
usually Gantt graphs use the whole width, but if you close your vault or change to another note, this particular mermaid graph snaps back to a very tight, compressed graph.
It must be a bug, bc if you click the edit button on the mermaid graph, it expands again. This is my experience at least.
Somewhat, yeah. I got it to work a little better byit works properly on the mermaid website, but it doesn’t work very well enough in obsidian. I was just hoping that there was a way to hard code unit width on the x axis, like setting 1 day to be a 50 pixel box.
TBH the current iteration of the code kind of functions by some miracle. I put this →
between mermaid and the gantt and suddenly I could see all the variables started working!!!
If I touch it or the css for this even after pressing undo section boxes start disappearing again so I’m keeping my fingers crossed. The code also works by itself so it’s possibly a problem with mermaid interacting with obsidian when it pulls chart specs from the window.