What I’m trying to do
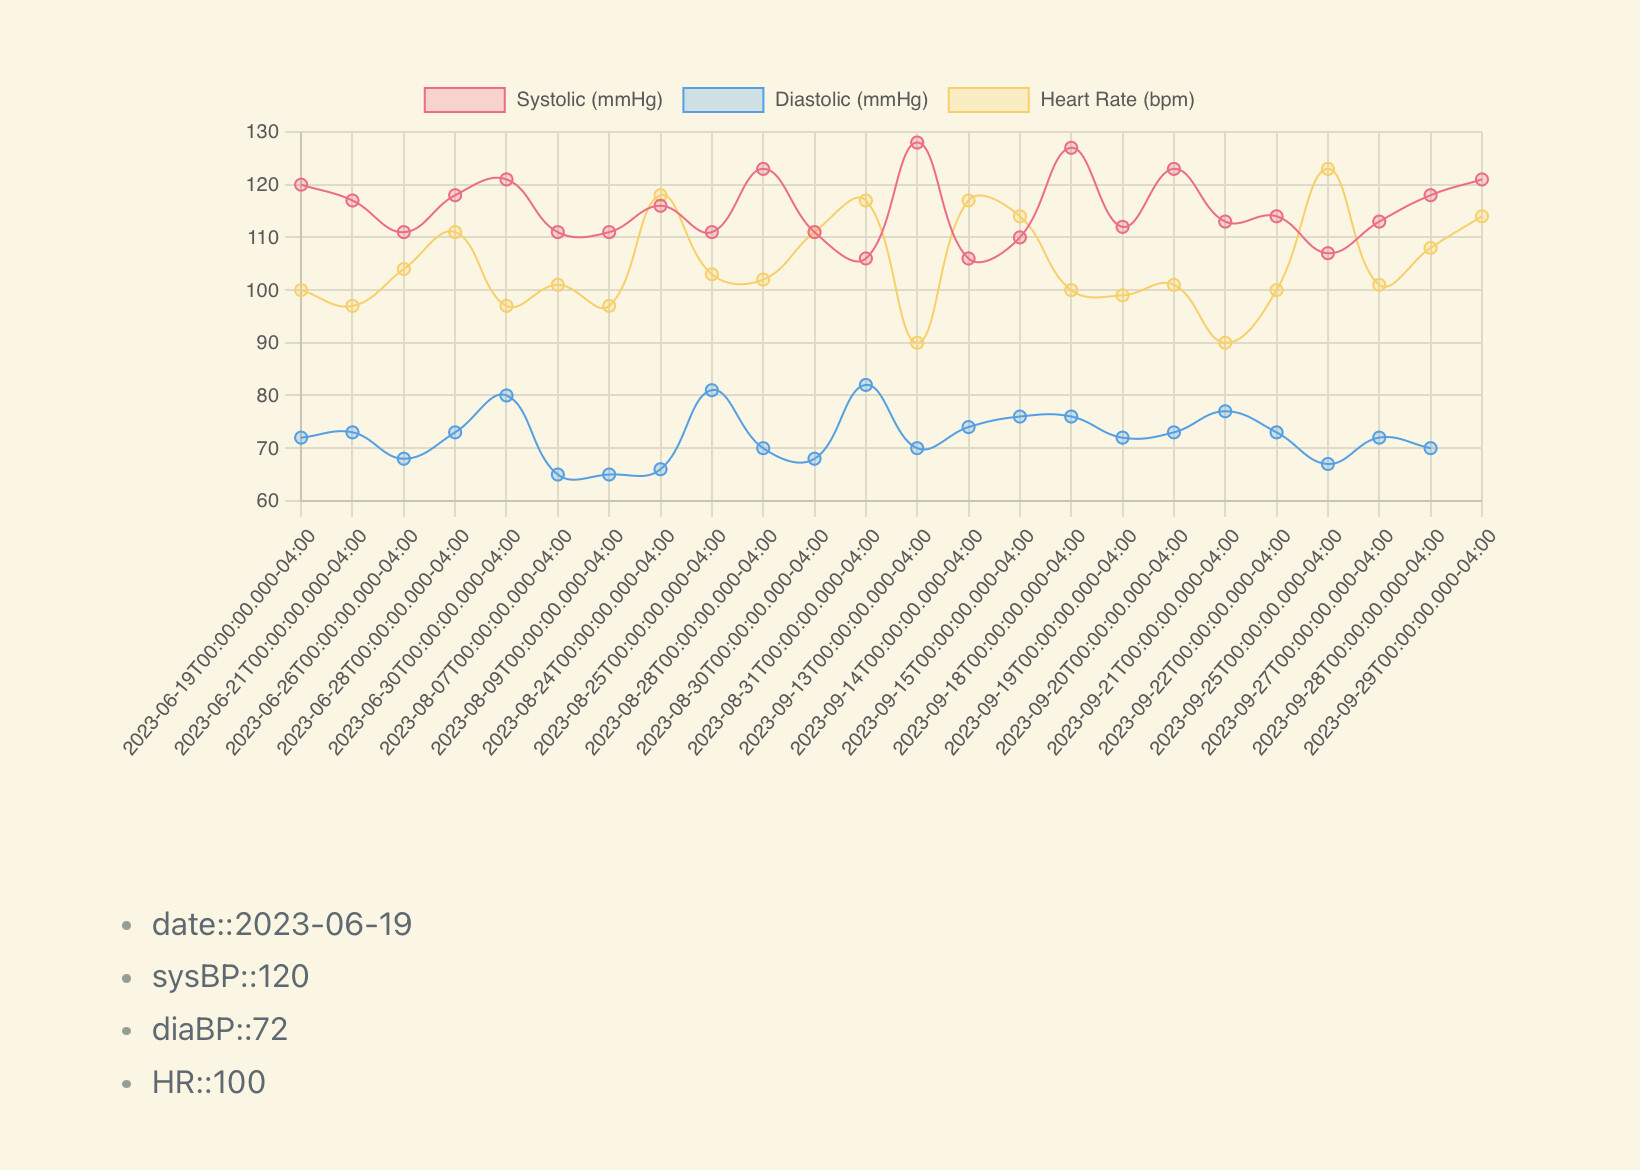
I’ve created a chart tracking blood pressure and heart rate after working out at the gym. The data renders successfully, but the date field along the x-axis displays dates as a long date-time, whereas I would prefer it display as at least YYYY-MM-DD or stretch across the x-axis as Month-Year.
The code I am using is
const data = dv.current()

dv.paragraph(`\`\`\`chart
    type: line
    labels: [${data.date}]
    series:
    - title: Systolic (mmHg)
      data: [${data.sysBP}]
    - title: Diastolic (mmHg)
      data: [${data.diaBP}]
    - title: Heart Rate (bpm)
	  data: [${data.HR}]
	tension: 0.4
	labelColors: false
	fill: false
	beginAtZero: false
	options: {
		aspectRatio: 1
		}
\`\`\``)
The screenshot below shows the result along with a sample of in-line data.
Things I have tried
Reviewed Obsidian Charts documentation, chart.js examples, as well as a number of forum posts.
I suspect this is a basic question, but I do not have a programming background. Have only stumbled into js as a necessity through using Obsidian and becoming more familiar with web design in the last 18 months. I’m also not opposed to taking a different approach, provided it helps me understand the basics better.