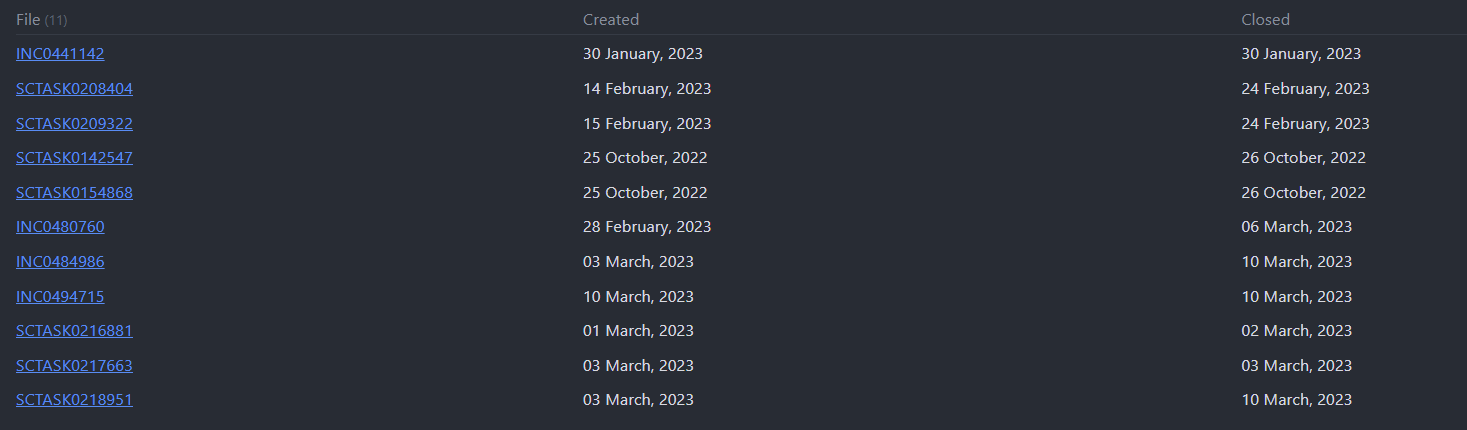
The trick to making this happen is to move the calculation from the column definitions into a FLATTEN field, like the following:
```dataview
TABLE Difference
FLATTEN (Closed - Created).days as Difference
WHERE
  contains(file.name,"INC") OR
  contains(file.name,"SCTASK") AND
  !contains(Closed, null) AND
  !contains(Created, null)
```
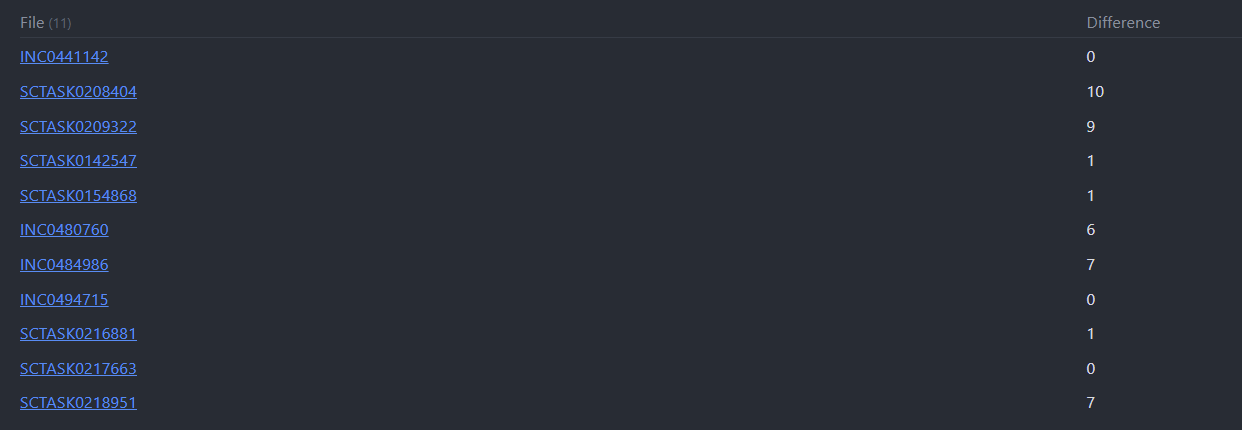
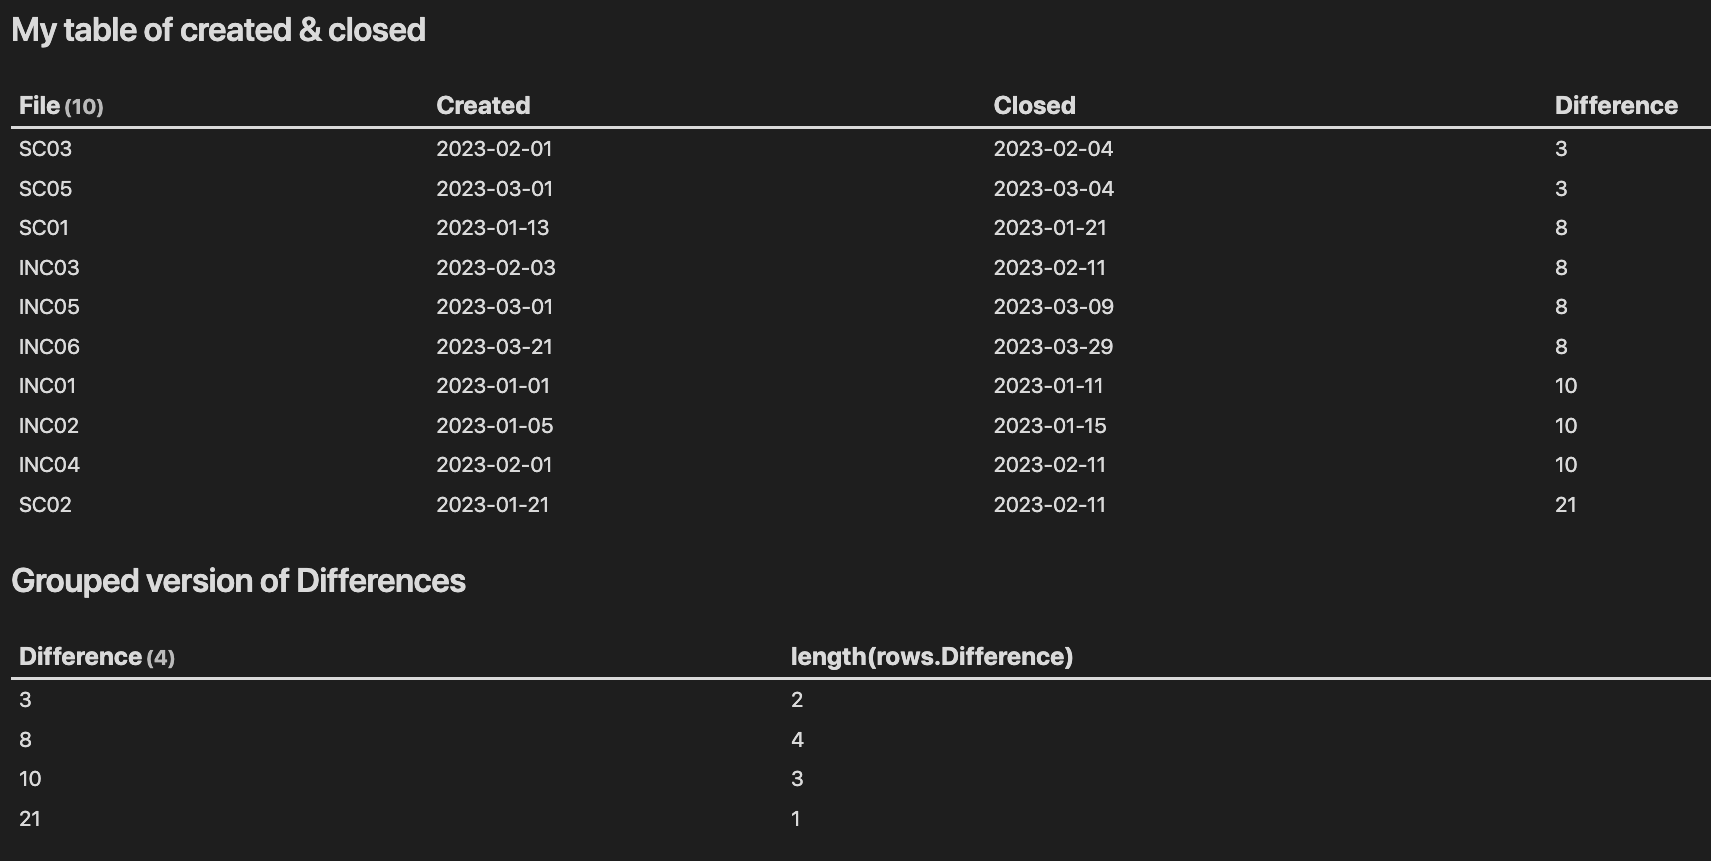
Since the difference is now a calculated field, you’re also allowed to do GROUP BY Difference, and then do a length(rows.Difference).
Two temporary queries to show this logic
Pop the code below into a note of its own, and see the magic unfold. 
## My table of created & closed
```dataview
TABLE WITHOUT ID tmp[0] as File, tmp[1] as Created, tmp[2] as Closed, Difference
FLATTEN list(
  ["INC01", "2023-01-01", "2023-01-11"],
  ["INC02", "2023-01-05", "2023-01-15"],
  ["SC01", "2023-01-13", "2023-01-21"],
  ["SC02", "2023-01-21", "2023-02-11"],
  ["SC03", "2023-02-01", "2023-02-04"],
  ["INC03", "2023-02-03", "2023-02-11"],
  ["INC04", "2023-02-01", "2023-02-11"],
  ["INC05", "2023-03-01", "2023-03-09"],
  ["INC06", "2023-03-21", "2023-03-29"],
  ["SC05", "2023-03-01", "2023-03-04"]) as tmp
FLATTEN (date(tmp[2]) - date(tmp[1])).days as Difference
WHERE file.name = this.file.name
SORT Difference
```

## Grouped version of Differences
```dataview
TABLE length(rows.Difference)
FLATTEN list(
  ["INC01", "2023-01-01", "2023-01-11"],
  ["INC02", "2023-01-05", "2023-01-15"],
  ["SC01", "2023-01-13", "2023-01-21"],
  ["SC02", "2023-01-21", "2023-02-11"],
  ["SC03", "2023-02-01", "2023-02-04"],
  ["INC03", "2023-02-03", "2023-02-11"],
  ["INC04", "2023-02-01", "2023-02-11"],
  ["INC05", "2023-03-01", "2023-03-09"],
  ["INC06", "2023-03-21", "2023-03-29"],
  ["SC05", "2023-03-01", "2023-03-04"]) as tmp
FLATTEN (date(tmp[2]) - date(tmp[1])).days as Difference
WHERE file.name = this.file.name
GROUP BY Difference
```
Note that in addition to the wanted logic, I’m faking the input data into the tmp list, but I reckon you can see the similarity with your own query.
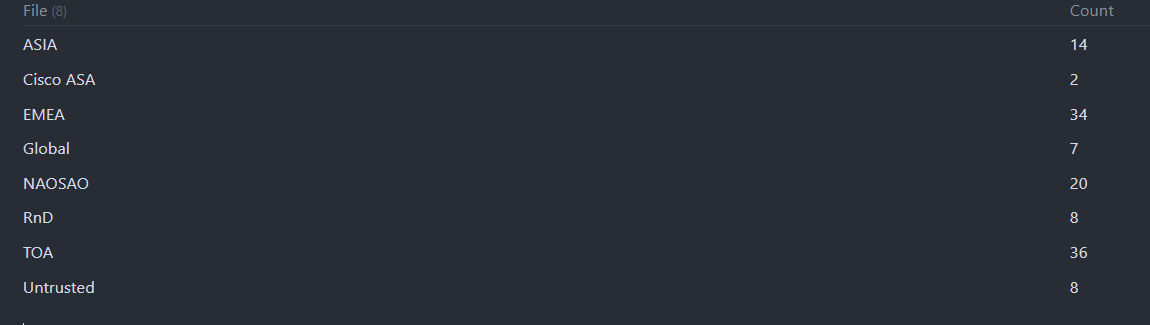
Output from these queries:
I’m a little unsure on what result you want out of this. Do you want to list any ticket with either a Created or Closed within that month? But you don’t want to rely on the actual dates in the tickets. It’s somewhat easy if you do just one of them, but I’m not sure what’s the best way to handle both of them.
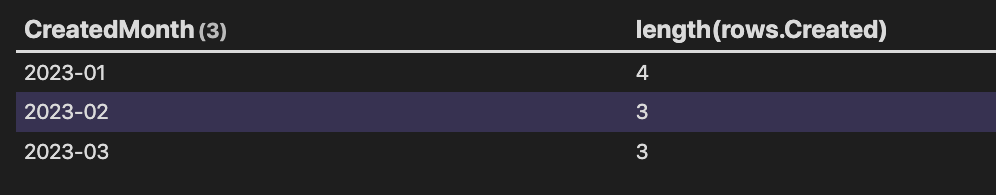
Issue 2 - Alt A - Just “Created” in DQL
The following will also apply for the Closed, so using the same trick as in the previous query the following should work:
```dataview
TABLE length(rows.Created)
FLATTEN dateformat(Created, "yyyy-MM") as CreatedMonth
WHERE contains(file.name,"INC") OR contains(file.name,"SCTASK") AND !contains(Created, null)
GROUP BY CreatedMonth
```
However, we can’t duplicate this logic directly, since both the fields should be able to be not set, and it’s not a given that they’re created and closed within the same month.
Test query for Issue 2 on Created
```dataview
TABLE length(rows.Created)
FLATTEN list(
  ["INC01", "2023-01-01", "2023-01-11"],
  ["INC02", "2023-01-05", "2023-01-15"],
  ["SC01", "2023-01-13", "2023-01-21"],
  ["SC02", "2023-01-21", "2023-02-11"],
  ["SC03", "2023-02-01", "2023-02-04"],
  ["INC03", "2023-02-03", "2023-02-11"],
  ["INC04", "2023-02-01", "2023-02-11"],
  ["INC05", "2023-03-01", "2023-03-09"],
  ["INC06", "2023-03-21", "2023-03-29"],
  ["SC05", "2023-03-01", "2023-03-04"]) as tmp
FLATTEN dateformat(date(tmp[1]), "yyyy-MM") as CreatedMonth
WHERE file.name = this.file.name
GROUP BY CreatedMonth
```
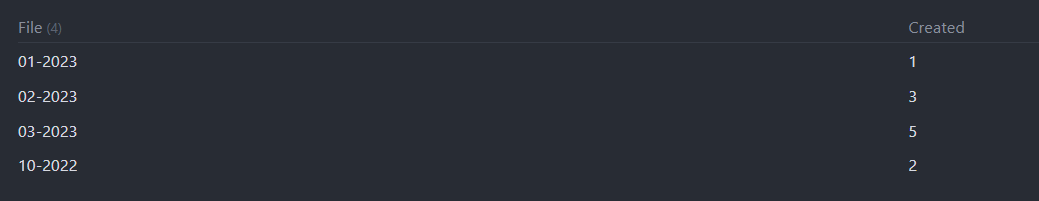
With output:
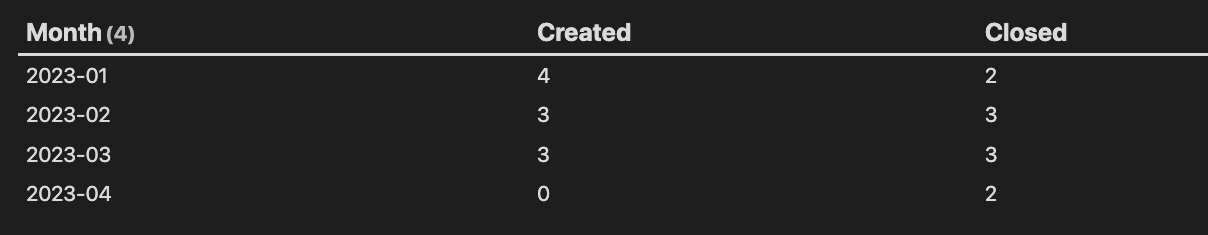
Issue 2 - Alt B - Both “Created” and “Closed” using DQL
The gist of this query is that we create both CreatedMonth and ClosedMonth, and then create a new column to preserve the month, and what happened this month. So if the entry is ["2023-01", 1, 0] it’s a created ticket, and if the entry is ["2023-01", 0, 1] it’s a closed ticket.
These two values are then split into separate rows, (so now each original row is two rows, one for created and one for closed), and group by the month in the first column. Now we can simply(?) sum up the values belonging to either the created or closed category.
Alt 2 queries
### Dual-month column
```dataview
TABLE WITHOUT ID theMonth, CreatedMonth, ClosedMonth, tmp[0] as File
FLATTEN list(
  ["INC01", "2023-01-01", "2023-01-11"],
  ["INC02", "2023-01-05", "2023-02-15"],
  ["SC01", "2023-01-13", "2023-01-21"],
  ["SC02", "2023-01-21", "2023-03-11"],
  ["SC03", "2023-02-01", "2023-02-04"],
  ["INC03", "2023-02-03", "2023-03-11"],
  ["INC04", "2023-02-01", "2023-02-11"],
  ["INC05", "2023-03-01", "2023-04-09"],
  ["INC06", "2023-03-21", "2023-03-29"],
  ["SC05", "2023-03-01", "2023-04-04"]) as tmp
FLATTEN dateformat(date(tmp[1]), "yyyy-MM") as CreatedMonth
FLATTEN dateformat(date(tmp[2]), "yyyy-MM") as ClosedMonth
FLATTEN array([CreatedMonth, 1, 0] , [ClosedMonth, 0, 1]) as theMonth
WHERE file.name = this.file.name
```

### Split up again into Created & Closed
```dataview
TABLE
  sum(map(rows.theMonth, (r) => r[1])) as Created,
  sum(map(rows.theMonth, (r) => r[2])) as Closed
FLATTEN list(
  ["INC01", "2023-01-01", "2023-01-11"],
  ["INC02", "2023-01-05", "2023-02-15"],
  ["SC01", "2023-01-13", "2023-01-21"],
  ["SC02", "2023-01-21", "2023-03-11"],
  ["SC03", "2023-02-01", "2023-02-04"],
  ["INC03", "2023-02-03", "2023-03-11"],
  ["INC04", "2023-02-01", "2023-02-11"],
  ["INC05", "2023-03-01", "2023-04-09"],
  ["INC06", "2023-03-21", "2023-03-29"],
  ["SC05", "2023-03-01", "2023-04-04"]) as tmp
FLATTEN dateformat(date(tmp[1]), "yyyy-MM") as CreatedMonth
FLATTEN dateformat(date(tmp[2]), "yyyy-MM") as ClosedMonth
FLATTEN array([CreatedMonth, 1, 0] , [ClosedMonth, 0, 1]) as theMonth
WHERE file.name = this.file.name
GROUP BY theMonth[0] as Month
```
Please do run these, and verify that you understand what’s happening. The first query (top part) should look like:
Note how each “file” has two rows, one for the creation and one for the closure of the tickets)
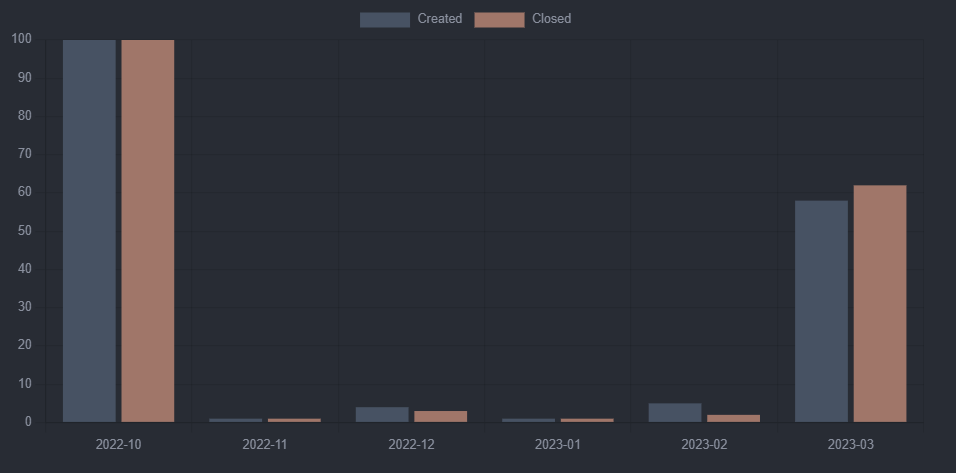
The second query should look like:
Note that in the second query the changes are the column output, and the addition of the GROUP BY theMonth[0] as Month line.
If you’re having a hard time understanding the second query, try adding rows.theMonth as a column (and view the result in a theme other than Minimal which shows the proper list levels)
Understanding the sum statement
The data input from rows.theMonth are in this format:
So the map(rows.theMonth, (r) => ... ) splits up this multi-level list on the first level (the empties…), and then the r[1] selects an element from the second level list (where r[0] is the first element, aka the month, and r[1] is the second element, which is the indicator of it being created or not. r[2] is then the third element indicating a closed ticket).
Then the sum( ... ) simplies sums up the corresponding list. So in this case it does sum( [1, 0] ) -> 1 for Created, and sum ( [2, 3] ) -> 5 (note that the 2 and 3 are just for illustration (so their origin). In the query they’re all 1’s or 0’s)
Please look through the queries of this second alternative, before you try to modify your own queries. I can’t easily test them for you, so the following is an attempt to adapt them to this logic, but it might very well contain some errors which I hope you’ll figure out.
```dataview
TABLE
  sum(map(rows.theMonth, (r) => r[1])) as Created,
  sum(map(rows.theMonth, (r) => r[2])) as Closed
FLATTEN dateformat(Created, "yyyy-MM") as CreatedMonth
FLATTEN dateformat(Closed, "yyyy-MM") as ClosedMonth
FLATTEN array([CreatedMonth, 1, 0], [ClosedMonth, 1, 0]) as theMonth
WHERE  contains(file.name, "INC")
   OR contains(file.name, "SCTASK")
  AND !contains(Created, null)
  AND !contains(Closed, null)
GROUP BY theMonth[0] as Month
```
The changes I’ve made are adding the two sum columns, the three FLATTEN rows, and then reformatted the WHERE clause (but not changed it), and added the GROUP BY row.
If something goes astray, try to remove the GROUP BY and sum columns, and change the TABLE line into something like TABLE theMonth, Created, CreatedMonth, Closed, ClosedMonth and see what looks wrong…
Question on boolean precedence
In both these queries you’re doing combination of OR and AND without using parenthesises. This leaves those boolean expression somewhat vulnerable for the precedence of the operators, and potentially strange results. It’s common to just use one type of operators without any operators like: test AND test2 AND test2, or alternatively test1 OR test2 OR test3. Both of these make sense, and are easily understood.
When you do test1 OR test2 AND test3 AND test4 it’s not a given what happens in the various cases, and you’re usually much better of doing something like (test1 OR test2) AND test3 AND test 4 where you require either test1 or test2 to be true, and both test3 and test4 to be true.
A simplified case of test1 OR test2 AND test3, could in some programming languages be short cut if test1 was true, since it’s OR’ed with the the rest. I tested this particular case within Obsidian, and it is evaluated as (test1 OR test2) AND test3 AND test4, but I would in most circumstances rather use this syntax, rather than the one without the parenthesis.
So for the latter query I would type it out as:
WHERE
   ( contains(file.name, "INC) OR
     contains(file.name, "SCTASK") )
  AND !contains(Created, null)
  AND !contains(Closed, null)
Another version of the same query (I think ) is
WHERE filter(list("INC", "SC"), (i) => contains(file.name, i))
  AND all(list(Created, Closed))
Not sure if the first is better or not, but it’s an alternate syntax which could come in handy if you got many alternatives.
This construct demands a truthy value in all elements in the list, see Functions - Dataview . Other variants include none and any, which respectively demands all to be non truthy (for example null), or any one of them being truthy.
So that should cover both issues, but I’m not entirely sure whether that second issues has the best solution as is. It could possibly be better to do that using dataviewjs, which would require a little javascript, but would potentially run smoother/faster. I’ve not typed out that solution though.
And a tip or two at the end to clarify your boolean expression, so that both Obsidian and humans reading your expression agrees on what is expected.