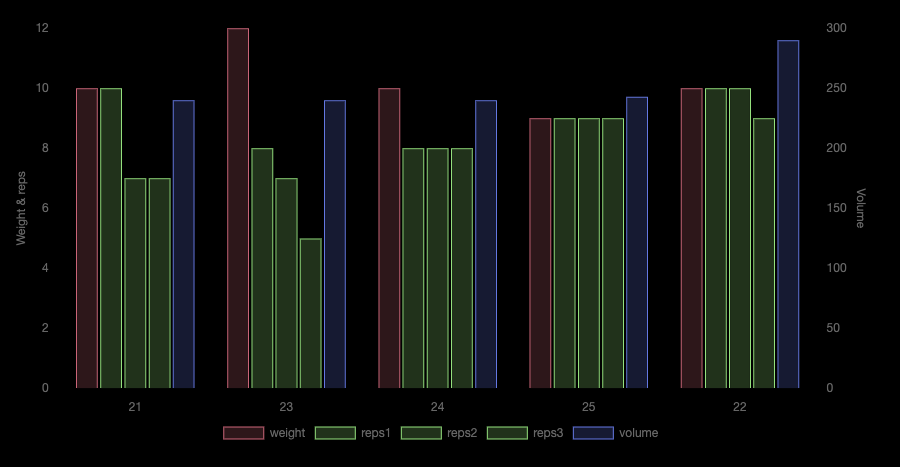
No problem, I wanted to investigate this for some projects of my own, and whilst at it, I created this monstrosity of a bar chart:
Full chart code to generate this chart
I used the same test data as in my previous reply, with the following chart code:
```dataviewjs
const result = await dv.tryQuery(`
TABLE WITHOUT ID
  exercise, date_of_workout, weight, reps1, reps2, reps3, volume
FROM #workouts
`)

const myHeaders = result.headers
const myLabels = result.values.map(d => d[1].day)
const myData = result.values[0].map((_, colIndex) => result.values.map(row => row[colIndex]))

const chartData = {
  type: 'bar',
  data: {
    labels: myLabels,
    datasets: [{
      label: myHeaders[2],
      data: myData[2],
      backgroundColor: 'rgba(255, 99, 132, 0.2)',
      borderColor:     'rgba(255, 99, 132, 0.9)',
      borderWidth: 1,
      yAxisID: 'left-y-axis'
    }, {
      label: myHeaders[3],
      data: myData[3],
      backgroundColor: 'rgba(99, 255, 132, 0.2)',
      borderColor:     'rgba(99, 255, 132, 0.9)',
      borderWidth: 1,
      yAxisID: 'left-y-axis'
    }, {
      label: myHeaders[4],
      data: myData[4],
      backgroundColor: 'rgba(99, 255, 132, 0.2)',
      borderColor:     'rgba(99, 255, 132, 0.9)',
      borderWidth: 1,
      yAxisID: 'left-y-axis'
    }, {
      label: myHeaders[5],
      data: myData[5],
      backgroundColor: 'rgba(99, 255, 132, 0.2)',
      borderColor:     'rgba(99, 255, 132, 0.9)',
      borderWidth: 1,
      yAxisID: 'left-y-axis'
    }, {
      label: myHeaders[6],
      data: myData[6],
      backgroundColor: 'rgba(99, 132, 255, 0.2)',
      borderColor:     'rgba(99, 132, 255, 0.9)',
      borderWidth: 1,
      yAxisID: 'right-y-axis'
    }]
  },
  options: {
    plugins: {
      legend: {
        position: 'bottom'
      }
    },
        scales: {
            'left-y-axis': {
                title: {
                  display: true,
                  text: "Weight & reps"
                },
                type: 'linear',
                position: 'left'
            },
            'right-y-axis': {
                title: {
                  display: true,
                  text: "Volume"
                },
                type: 'linear',
                position: 'right'
            }
        }
    }
}
// console.log(chartData)
window.renderChart(chartData, this.container)
```
Please don’t ask me to explain all the stuff going here. I’m not sure I really understand it myself. ![]() But do know that it’s possible to do a lot with this plugin, which relies upon Chart.js | Chart.js.
But do know that it’s possible to do a lot with this plugin, which relies upon Chart.js | Chart.js.
