(Mods, I wasn’t sure where to put this. I thought I’d put this here because it’s not about how to use the software. Please move if necessary!)
I’ve been finding the graph view very helpful to identify emergent themes as my vault grows. This has made me wonder how it is created. As someone with a masters in math and some training in physics, programming, and numerical methods, it’s made me curious about about the nuts and bolts. In the spirit of learning in public, I thought I’d share my own thoughts and see if anyone can add to or correct them. (I’m hoping a dev might consider doing this. You’re probably too busy, but either way, we love your product).
Warning: I’m going to write at a level targeted toward advanced undergraduates or people with some relevant graduate training. The Wikipedia page on Force-directed graph drawing has helpful background. I’ll gloss over the numerical methods and will avoid linear algebra (unlike Wikipedia).
The great thing about force directed graphs is that they’re easy to write. You just need a basic physics engine that keeps track of location and velocity, taking acceleration as given. (These aren’t hard to write if you know how to model discrete approximations of differential equations, so you can download components/libraries that handle this. There is an optimized version known as Verlet Integration, which is used in a software package called d3.js.)
Once you have your 2d or 3d physics engine and a front-end component to display it. There are only two things to do:
- Input initial location and initial velocity for each of the nodes.
- Input the forces that act on the nodes.
For the first step, it looks like Obsidian starts with the points fairly close together for a springy “big bang” effect. Perhaps they also add slightly random perturbations to the starting locations and give all nodes an initial velocity of 0 in both x and y directions.
For the second step, you likely want to start with force equations that approximate force equations people would see in the real world. Then you likely optimize the heck out of the system so it runs buttery smoothly and tweak it so it looks nice.
The point of this post is that I’m curious as to what equations they started with.
The Wikipedia page says, “Typically, spring-like attractive forces based on Hooke’s law are used to attract pairs of endpoints of the graph’s edges towards each other, while simultaneously repulsive forces like those of electrically charged particles based on Coulomb’s law are used to separate all pairs of nodes. In equilibrium states for this system of forces, the edges tend to have uniform length (because of the spring forces), and nodes that are not connected by an edge tend to be drawn further apart (because of the electrical repulsion).”
It seems plausible that they could be using a simulation based on modified versions of Hooke’s and Coulomb’s laws. For those who aren’t familiar with the physics, Hooke’s law defines how springs work. It causes spring-like action. Coulomb’s law would keep the nodes from getting too close, much like electrical forces cause atoms in a gas or solid to want to keep a certain distance from each other (IIRC). It is an “inverse square” law, which means it has a very big effect when the nodes get close.
That sounds good. So perhaps we can hypothesize that they started with:
- For all nodes x and y, Hookes_Spring_Force = (d(x, y) – p_link_distance) × p_link_force
- For all nodes x and y, Coulombs_Repelling_Force = -p_repel_force / (d(x, y)^2)
- Notation: x and y are the location vectors for nodes x and y. Snake case variable names that begin with “p_” refer to parameters set within the Obsidian GUI, as described below.
These forces would be calculate for each pair of nodes, x and y, but as an optimization, many pairs would like be omitted if distance was about some threshold. The two pairwise forces would operate along the vector directed at the other point.
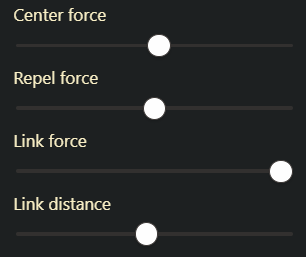
By p_repel_force, p_link_force, and p_link_distance, I’m referring to appropriately scaled versions of the numbers we can set the sliders in the “Forces” section of the Graph view settings:
In our context these parameters would be the constants in our force equations (the ones that begin with “p_”). Obsidian kindly lets us adjust those constants.
The third force would be the “Center force,” based on the corresponding slider. Pointing toward a moveable “center” of the graph, perhaps it would be something like:
- For all nodes x, Centering Force = min( d(center, x) - p_center_force, 0 )
Finally, there would be one last force that would allow you to drag points around:
- Dragging Force = d(mouse, x)^2
It would point from the node toward the mouse, of course.
I checked in on this in Discord. Many thanks to River who shared following about the physics engine obsidian uses: “They used to use d3js. They replaced it with Pixi, which is just a webgl renderer so now I’ve no idea what FDG implementation they might be using.”)
Anyway, that was my first draft, just for fun. I’d love to hear your thoughts/corrections, and if you don’t have a background in this and have any questions, I’ll be happy to answer them. It’s really just something fun and it felt like the obsidian community should have a post about it (I couldn’t find one).