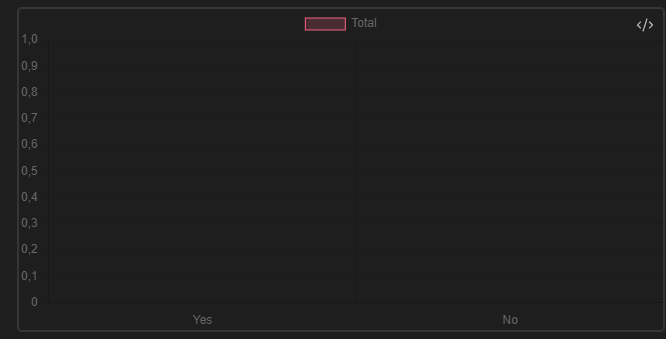
What I’m trying to do
So, I want to create some diagrams/chars from a CSV file using Dataview and Charts plugin.
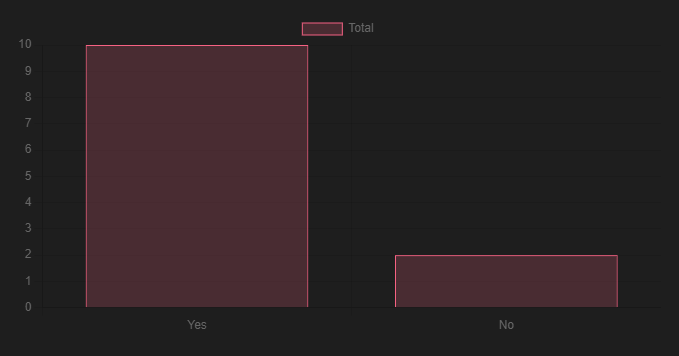
Currently I am trying to count the number of appearances of certain words/strings in the CSV, and then display them in a a bar chart.
This is what the CSV basic structure is.
Date, Daytime, WokeUpOnTime, Exception
15 05 2024 , Morning , Yes , Exception: None
16 05 2024 , Morning , No , Exception: None
This is my code so far:
const data = await dv.io.csv("Automated Files/WokeUpOnTime History.csv")


const labels = ['Yes', 'No'];
// iterate over the data dataview array and count how many yes and nos there are
var numOfYes = 0;
var numOfNo = 0;
for(var i=0;i<data.length;i++){
	//if(data[i] === "Yes")
	console
    if(data[i].WokeUpOnTime.includes("Yes"))
       numOfYes++;
    if(data[i].WokeUpOnTime === " No ")
       numOfNo++;
}

const chartData = {
  type: 'bar',
  data: {
    labels: labels,
    datasets: [{
		label: 'Total',
	    data: [numOfYes, numOfNo],
	    backgroundColor: [
        'rgba(255, 99, 132, 0.2)'
      ],
      borderColor: [
        'rgba(255, 99, 132, 1)'
      ],
      borderWidth: 1
    }]
  }
}
window.renderChart(chartData, this.container)
Currently it throws this exception:
Evaluation Error: TypeError: Cannot read properties of undefined (reading ‘includes’)
at eval (eval at (plugin:dataview), :15:29)
at async DataviewJSRenderer.render (plugin:dataview:18922:13)
Things I have tried
I tried using the “contains” function from Dataview JS but it just threw a similar error just instead of ‘includes’ now with ‘contains’
In the Dataview documentation includes is listed as a function for data arrays, so I guess my syntax is just way off here, but I can’t figure it out how it should look.


