Frontmatter multi-value property to Dataview Table

I’d like to store workout data for use in a table as a key in the frontmatter. As an example, I was hoping to have something like this in the frontmatter:

squat: 150,8,8,7
deadlift: 200,8,8,7

And have it displayed in a dataview table like:

Exercise Weight Set 1 Set 2 Set 3
Squat 150 8 8 7
Deadlift 200 8 8 8

Possible?

It could be possible, but it can be tricky… Does the number of sets vary a lot? Is it always a given that the first value is an indicator like the weight?

Would you be opposed to changing the format to something like:

exercise:
- name: deadlift
  weight: 200
  sets: 8,8,8

You’ll still have some issues with splitting the sets into columns, but it’ll be easier to make tables with varying exercises (aka you don’t need to specify each and every exercise by name).

Ideally it would accommodate varying numbers of sets as my routines are bound to change over time. Yes, easy enough to always put the weight first. I imagined it might be possible to do something like “let weight = file.deadlift[0];let set1 = file.deadlift[1]” etc but even if I could define those I don’t know dataview or dataviewjs enough to know how to coax them into a table.

You’re proposal is not nearly as elegant/concise, but I’m open to whatever options might work. I’ve not used ‘nested’ properties before, so I’m even more in the dark about how to pull that into a table.

The question with your original format is how do you detect what are exercises, and what’s other properties? Like in the following example:

---
date: 2023-12-26
tags: exercise, year2023
squat: 150, 8, 8, 7
deadlift: 200, 8, 8, 8
---

So continuing with my other format, and some dataviewjs magic, we arrive at the following:

---
exercise:
- name: squat
  weight: 150
  sets: [1, 2, 3]
- name: deadlift
  weight: 200
  sets: [4, 5, 7]
- name: too easy
  weight: 1
  sets: [8, 9, 10, 11, 12, 13, 14, 15]
---
questionUrl:: http://forum.obsidian.md/t//73581

## Test data from current file
```dataview
TABLE WITHOUT ID e.name, e.weight, e.sets, length(e.sets)
WHERE file = this.file
FLATTEN exercise as e
```

## Table based upon current file
```dataviewjs
const thisFile = dv.current().file.name

let max = 0
const result = dv.pages()
  .where(p => p.file.name == thisFile)
  .exercise
  .map(e => { 
     const count = e.sets.length
     if (count > max) max = count
     return [e.name, e.weight, ...e.sets ] 
   })

let headers = ["name", "weight" ]
for (let setNumber = 1; setNumber <= max; setNumber++ ) {
  headers.push("Set " + setNumber)
}

dv.table(headers, result)

```

Which return this table:

It’s not a perfect solution, as we should really re-iterate the result table to add the empty columns for those exercises not having the max number of sets, but I leave that as an exercise to the reader (pun intended :wink: )

The trick used in this script is the ...e.sets which transposes the array into values of the new array we’re creating in the .map() function. This transforms the element of a list into multiple columns in the result array.

In addition the map() function keeps track of how many elements there are in each sets variant, in order to build the correct number of header columns when we’ve looped through all the exercises.

1 Like

Very cool. This does give me the table I was looking for, and I like how the sets are variable, very clever. Getting the data into the frontmatter is another story, since doing it through the new properties window doesn’t look very appealing (doesn’t seem I can even edit it that way, must switch to source mode). I still wonder if a non-nested option is possible. You asked how to detect exercises: what if all exercises begin with “🏋🏻‍♂️_” or “WO_” (eg. 🏋🏻‍♂️_squats: 200,8,8,7)? Seems this would avoid the complications of nested properties.
Expanding on this, lets say I keep this data in the frontmatter of my journals, which are named by date. I want a “Squats.md” page that has a table showing all the weight and set info from each workout to help view progression. Or even, getting dreamy here, pulling the data into Tracker so I can have a graph showing progress. Possible options, and do the possibilities become more or less possible based on the format of the frontmatter?

The thing is that we don’t easily get a list of the keys (or property names) of the frontmatter/property, so although it kind of would make it easier with a given prefix, you’re still not entirely there. Another option, however, to avoid nested properties would be to use something like the following:

---
🏋🏻‍♂️: [ squat, deadlift ]
🏋🏻‍♂️_squat: [150, 1, 2, 3]
🏋🏻‍♂️_deadlift: [200, 4, 5, 6]
---

```dataviewjs
const exercises = dv.current()["🏋🏻‍♂️"]

const allWO = []
exercises.map(e => {
  const wo = dv.current()["🏋🏻‍♂️_" + e]
  allWO.push(e + ", weight: " + wo[0] + ", sets: " + wo.slice(1))
})

dv.list(allWO)
```

This would output:
image

But it isn’t properly recognised as a list of numbers in the property editor. Not sure why, though. And of course, you’d have to adapt the other query to use this list instead.

Using my first syntax, it would be easy to extract the information for a “squats.md” note. It would also be doable using my second suggestion on format in previous reply.

Regarding Tracker I’m having mixed experience with that plugin, so I’m not sure how it would behave. I do however now that as long as you’re able to manipulate the tables (like using either of my suggested formats), it should be doable to get Obsidian charts to display graphs of your progress.

The format of the frontmatter has the following effects:

  • Changes the possibility for automatic processing
  • Changes how easy it is to extract the data into a query (or graph)
  • Changes how easy it is to update/modify the data within the property editor

So I’m not quite sure if we’ve arrived at the best option yet with either format. Some of them are workable, but not easy to edit, and some are easy to edit but easily available for processing and queries…

I need to think a little more on whether there is a even better format, which also is easy to use when editing. But I’m a little baffled that it’s not easy to get a list of numbers with the current property editor (maybe I’m just ignoring something obvious, but I’ve not found that yet…)

I’m still relatively new to DataView, but is it possible to nest via the folder structure

folder: Squats

  • File: 200 lbs
    *** Frontmatter: |Set 1|Set 2|Set3|

folder: deadlift

  • File: 150 lbs
    *** Frontmatter: |Set 1|Set 2|Set3|

And then potentially roll things back up via the dataview query

Hello, maybe you could try this code:

---
🏋🏻‍♂️: [ squat, deadlift ]
🏋🏻‍♂️_squat: [150, 1, 2, 3]
🏋🏻‍♂️_deadlift: [200, 4, 5, 6]
---

```dataviewjs
const exercises = dv.current()["🏋🏻‍♂️"]

const tableHeaders = ["Exercise", "Weight", "Set1", "Set2", "Set3"]
const tableRows = exercises.map(e => {
  const wo = dv.current()["🏋🏻‍♂️_" + e]
  return [e, wo[0], ...wo.slice(1)] // Using spread operator to include individual sets
})

dv.table(tableHeaders, tableRows)

Thanks to you both @holroy and @nenebishop for the suggestions! I’m still looking at the options, and have been trying to learn from your examples to explore on my own as well. I still struggle with how to best get the data in since the new Properties panel doesn’t support lists that include the same item more than once, and doesn’t do any justice to nested properties. I’ve considered making workouts their own note instead of being part of my journals, and have also considered trying the Modal Forms plugin as a way of inputting the data in a friendlier manner (will take a bit of playing to learn how to do that, and not yet sure if it will do what I need). I’ll keep exploring, but if you or anyone else has ideas on how to track the kind of workout data I’m gathering, with the ability to easily look at a days workout, and the ability to have that data gathered up on individual exercise pages to show progress, I’m open to suggestions!

Allow me to get a little philosophical, and ask the question what is the proper use of properties and a journal note? From my point of view I think the properties should be just that, properties of the current note. And I believe that the payload, aka exercises, should be kept within the main note. After all, we’re talking about your daily journals, and you exercising is a part of that.

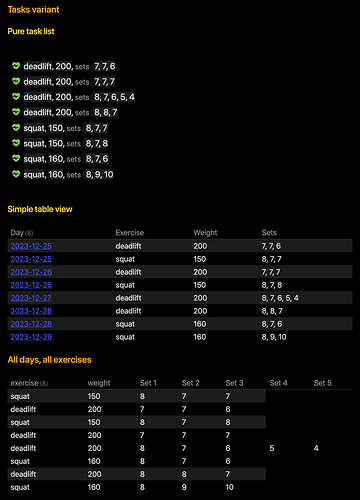
With that in mind, I’d like to suggest a different approach to storing these data , and showcasing them in a slightly better manner (in my opinion). Imagine adding decorated tasks like the ones below into your daily journals:

- [t] (type:: squat), (weight:: 150), [sets:: 8, 7, 8]
- [t] (type:: deadlift), (weight:: 200), [sets:: 7, 7, 7]

Which with some custom CSS could look like:
image

Some details related to my markup

In my setup I use t to denote “training”, but you could of course use whatever letter you’d like. I’ve also here used inline fields, and they can be grouped either by ( ... ) where the field name is not displayed, or [ ... ] where the field name is displayed (as for the last field sets). These can be styled however you’d like them to be, and you’re free to choose field names and so on, as you’d like.

This allow for a variety of queries:

## Tasks variant

### Pure task list
```dataview
TASK
FROM "ForumStuff/f73/f73581"
WHERE status = "t"
SORT type, file.day
```

### Simple table view
```dataview
TABLE WITHOUT ID 
  file.link as Day, 
  task.type as "Exercise", task.weight as "Weight", join(task.sets, ", ") as Sets
FROM "ForumStuff/f73/f73581"
FLATTEN file.tasks as task
WHERE task.status = "t"
SORT file.day, task.type
```


## All days, all exercises

```dataviewjs
const thisFile = dv.current().file.name

let max = 0
const result = dv.pages('"ForumStuff/f73/f73581"')
  .file.tasks
  .where(t => t.status == "t")
  .map(e => { 
     const count = e.sets.length
     if (count > max) max = count
     return [e.type, e.weight, ...e.sets ] 
   })

let headers = ["exercise", "weight" ]
for (let setNumber = 1; setNumber <= max; setNumber++ ) {
  headers.push("Set " + setNumber)
}

dv.table(headers, result)

```

Which display as:

Some advantage of this kind of setup:

  • In a given day it clearly shows which exercises you did, due to use of icons and clear descriptive text
  • It’s easily queried (with backlinks) as tasks, thusly allowing you a neatly compound object or a nested property so to speak
  • It’s easy to pick out exercises of a given type, or a given time period, since all this information is readily available
  • The syntax for adding sets is also easy, since we can just list the number of the various sets directly as pure text
  • And it also allows for styling to your hearts content if you’re into that

Wow, thanks for thinking outside the box! I wouldn’t have considered this approach, but it seems to do everything I was looking to do. I’m going to play with it a bit, and will respond again after trying it out, but it looks very promising. Thanks again for all the thought you’ve put into this, Happy Holidays!

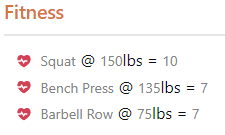
So far so good. I’m now entering my workout info like this in a daily note:

- [f] (type:: Squat) @ (weight:: 150)lbs = (sets:: 8,8,10)
- [f] (type:: Bench Press) @ (weight:: 135)lbs = (sets:: 8,8,7)
- [f] (type:: Barbell Row) @ (weight:: 75)lbs = (sets:: 8,8,7)

Which looks like this in Preview mode (were I usually live)
image
You can see the sets don’t get listed properly (they do in reading view). I tried looking for a solution in the CSS but it seems like the data isn’t even there, so not sure if anything can be done. Not the end of the world as the last set is the most important anyway.

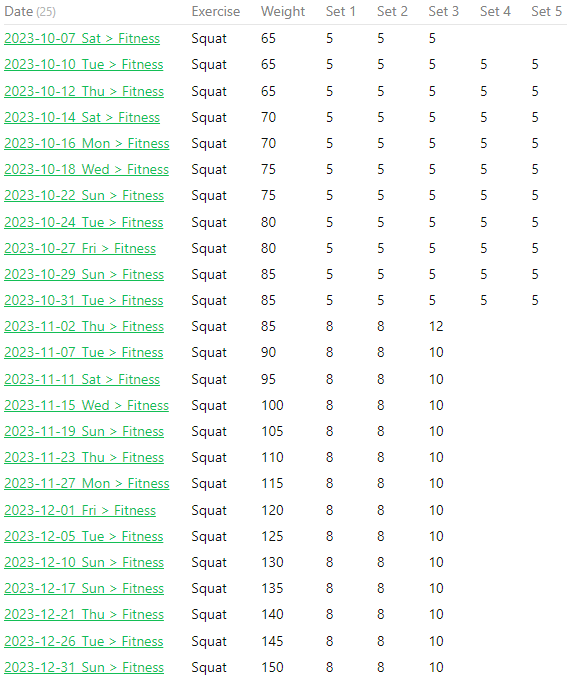
For each exercise I then have a note with a table:


Makes it easy to see progress. For some reason the .link includes the section header after the file name. Any idea on how to just get a link to the filename? Here’s the code I’m using:

```dataviewjs
let max = 0
const result = dv.pages('"_Journals"')
  .file.tasks
  .where(t => t.status == "f" && t.text.includes('Squat'))
  .sort(k => k.link, 'asc')
  .map(e => { 
     const count = e.sets.length
     if (count > max) max = count
     return [e.link, e.type, e.weight, ...e.sets ] 
   })
let headers = ["Date", "Exercise", "Weight" ]
for (let setNumber = 1; setNumber <= max; setNumber++ ) {
  headers.push("Set " + setNumber)
}
dv.table(headers, result)
```

I haven’t attempted a graph yet but will likely look into that at some point.
Thanks for all your help (and to the others that also contributed), this is definitely a big improvement over the unstructured way I was keeping track of it previously. Happy New Year!

I did some tests using ` dv.span(dv.current()) `, and dataview sees the data, but in the presentation the number lists collapses into the last element. I’m not quite sure why, but I do believe you should report it as a bug related to dataview on dataview issues.

You’re quite correct that it doesn’t show in the DOM presentation of live preview, but that it do appear in reading mode. Very strange…

Thanks for confirming that something is off there, I just filed a bug report.

This topic was automatically closed 90 days after the last reply. New replies are no longer allowed.