I’m trying to create a table using dataviewjs that groups the data by date. It is doing something in that it creates a table with the correct columns and the right number of rows, but every cell just has a ‘-’ in it! Without grouping, just displaying all the data it works fine.
Things I have tried
Googling suggests it might be to do with flattening the data, but I can’t see how/ why that would make much difference, nor how to do it. The data from each page is just one date, one bookmaker, one type and one outcome. This is the code thus far:
let pages = dv
	.pages('"900 MB/Data"')
	.groupBy(b => b.Date)

let totalOutcome = pages.map((page, index) => [
    page.Date,
    page.Bookmaker,
    page.Type,
    page.Outcome,
  ]);

dv.table(["Date", "Bookmaker", "Type", "Outcome"], totalOutcome);
After .groupBy(b=> b.Date),Date becomes key,and the others become rows,so you should try another way. For example:
let pages = dv
.pages('"900 MB/Data"')
.filter(b=> b.Date) // Only show file has "Date"
.groupBy(b => b.Date)
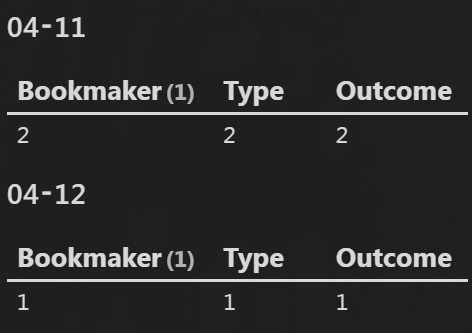
for (let p of pages) {
dv.header(4, p.key)
dv.table(["Bookmaker", "Type", "Outcome"], p.rows.map(r=> [r.Bookmarker, r.Type, r.Outcome]))
}
The solution provided by @PlayerMiller is a nice solution, but it do introduce multiple headers, which in some cases is not wanted. However, the indication of rows being added when doing groupBy is very correct, and slightly confusing to deal with.
Here is another example presenting the result in just one table:
Here I’m listing the 50 first files, and group by the size of the files (Sorry, I was a little lazy not recreating your example data). What’s interesting though is how to deal with the data after the grouping. First note that we need to use pages.values.map to even get to the data, and then since we’ve grouped them together we need to do new mappings on each row since the values have been collated into the rows object.
The console.log(pages) is not really used, but very helpful for debugging purposes, as it prints out the contents of pages into the Console pane within Developers tools. Doing stuff in dataviewjs do sometime require the use of debug output in there, so try to locate it and see what you make out of it. When you’re done debugging, you could either remove that line, or add // in front of it to comment it out, so it’s done all the time.
Thank you both, especially @PlayerMiller for the insight about how groupBy works and the nature of rows being added - I just couldn’t work out what was happening. I think I have enough to get what I want working now. Once I’ve confirmed it over the weekend I’ll post a full working solution for anyone else who wants to do something similar in the future!