I’m sure we can work things out here, @snowbiker100. ![]()
As @scholarInTraining pointed out I have a rather simple chart inside of one of my notes that shows me the development of the downloads of my “Table to CSV exporter” plugin.
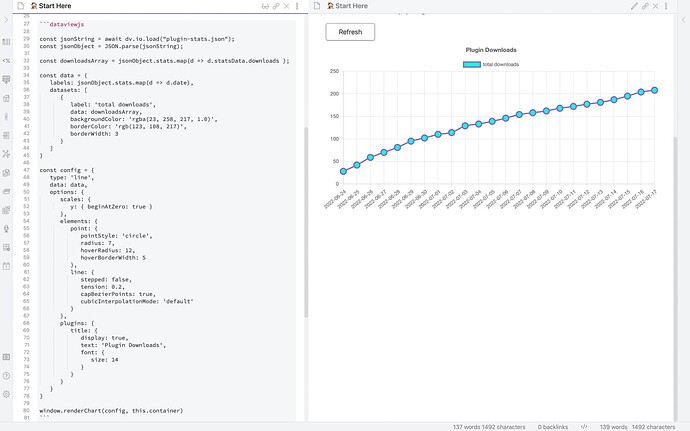
Because the data I want to visualize her resides in a JSON file of some sort/syntax I have to use a dataviewjs block rather than a dataview block because I have to read in the data from the JSON file it’s in and extract the x-axis (called labels in chart.js – on which the plugin “Obsidian Charts” is based) and y-axis data.
Here’s a screenshot of the dataviewjs source left and the result with the “Obsidian Charts” plugin on the right.
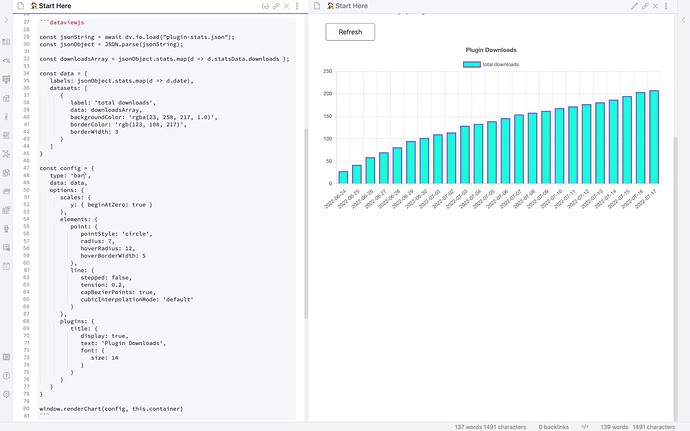
If I change the chart type to bar I get a bar chart of the same data like this:
Your data has to be simply inside of a JavaScript array if you use a dataviewjs block.
btw, the “Obsidian Charts” documentation is rather sparse and I find myself often on chartjs.org to learn more about all the options & possibilities. ![]() Browsing the samples there helps me, too.
Browsing the samples there helps me, too.
If you have multiple data sets you’d have to add a 2nd, 3rd, … set to the datasets array – in my case that’s inside the const data structure. Each dataset is a dictionary and should at least contain a label (x-axis) and data (y-axis) key with arrays as values, respectively.
Does this help a bit? Don’t be shy to ask more questions! We’ll get there eventually! ![]()

