Now it renders like this:
And i want to render like this:
I see. I only know how to help with part of that. To get rid of the grouping into different lists, pass false
as a second argument to the dv.taskList
call. i.e. dv.taskList(..., false)
. You might be able to change what is displayed per-line by using a call to map(t => ...)
at the end of your query after all the filtering and sorting. I imagine you could use that to put the file link in front of the task text for example. However since the due date is part of the task text
I’m not sure how you would reorder that.
First, thank you for sharing this and for all your other generous activity in the forum.
Because the Hotkey names are given in terms of Windows naming conventions, e.g. Alt not Opt, it can be confusing. This is particularly true for hotkeys that use the Mac Control key as it also listed as Ctrl. For example:
Ctrl+,
. On a Mac that translates to Command+,
Control+,
(Mac key names), it also shows up in the DV table as Ctrl+,
Here’s a clipping from the report after assigning Open Vault to “Control+,” as described above.
Both Open Settings and Open Vault appear to be assigned to “Ctrl+,” when, in fact, settings uses Command and Vault uses Control.
Would it be possible to modify the script to show the key names in Mac-speak (Command, Control, Option)?
Hya,
sorry for the sudden ping on this, but it is almost exactly what I need.
A few short questions:
What :: DataviewJS By Example Q181
fromURL :: patrick_ambrosso: DataviewJS Snippet Showcase Q181
Question :: How to get the number of orphan notes?
Answer :: See Code T06_A first.
WebUpdatedOn :: 2022-06-25
KeyClasses :: DataviewJS
toURL :: Solutions
T06_A_the number of orphan notes: $=dv.pages("#Habit").where((page)=>page.file.inlinks.length===0&&page.file.outlinks.length===0).file.name.length
5
dv.span()
or dv.list()
may be omitted in Inline DataviewJS Queries.T06_B_the number of orphan notes: $=dv.span(dv.pages("#Habit").where((page)=>page.file.inlinks.length===0&&page.file.outlinks.length===0).file.name.length)
5
T06_C_the number of orphan notes:
dv.span(
dv
.pages("#Habit")
.where(
(page) =>
page.file.inlinks.length === 0 &&
page.file.outlinks.length === 0
).file.name.length
);
5
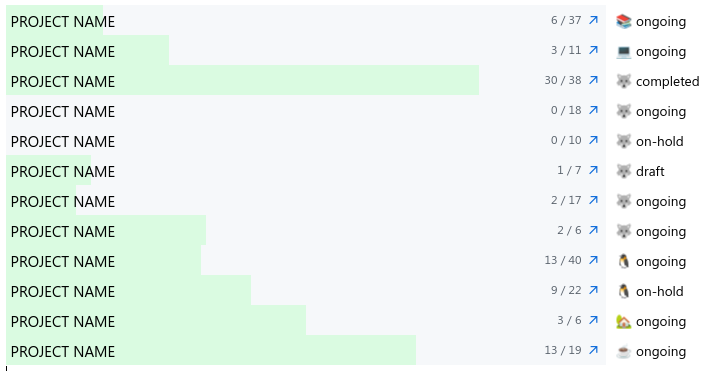
Example of progress visualization via background color.
Problem: I wanted to visualize project progress, but printing just test looks boring and HTML progress
element is actually an input which looks redundant. The idea is to use background color under project name, so it doesn’t take extra space. I followed the prototype you can check on StackOverflow.
DataviewJS:
// project icon, status etc comes from note frontmatter
// you may different props
const projects = dv.pages('"Backlog" and #project').sort(project => project.icon, 'desc');
for (let project of projects) {
const total = project.file.tasks.length;
const completed = project.file.tasks.filter((task) => task.completed).length;
const rootEl = await dv.el('div', '', { cls: 'x-project-status' });
const progressEl = rootEl.createEl('div', { cls: 'x-progress', attr: { 'data-label': project.file.name } });
progressEl.createEl("a", { cls: 'x-percentage-fill', attr: { style: 'width:' + (completed / total * 100) + "%;" } });
progressEl.createEl("a", { text: '↗', cls: 'x-link', attr: {
href: project.file.link.path,
'data-href': project.file.link.path,
'aria-label': project.file.link.path,
'aria-label-position': 'top',
target: '_blank',
rel: 'noopener'
} });
progressEl.createEl("span", { text: completed + ' / ' + total, cls: 'x-stat' } );
rootEl.createEl("span", { text: project.icon + ' ' + project.status, cls: 'x-metadata' } );
}
CSS:
.x-project-status {
display: flex;
flex-direction: row;
align-items: center;
}
.x-project-status>.x-progress {
height: 2em;
width: 40em;
background-color: #f6f8fa;
position: relative;
}
.x-project-status>.x-progress:before {
content: attr(data-label);
position: absolute;
text-align: left;
top: 5px;
left: 5px;
right: 0;
}
.x-project-status>.x-progress>.x-percentage-fill {
background-color: #dafbe1;
display: inline-block;
height: 100%;
}
.x-project-status>.x-progress>.x-link {
position: absolute;
text-align: right;
top: 5px;
right: 5px;
text-decoration: none;
color: #0969da;
}
.x-project-status>.x-progress>.x-stat {
position: absolute;
text-align: right;
top: 5px;
right: 2em;
color: #57606a;
font-size: 0.8em;
}
.x-metadata {
padding-left: 10px;
font-size: 0.9em;
}
Result:
I know a teeny tiny bit of dvjs. I have a use case for it that is probably very easy. I’d like to count the number of times a set of words or phrases show up in my “wellness” field. I want to map how many times I’ve done certain things – or logged them at any rate.
field example:
in my daily notes, in my “Bujo” folder, each day has this kind of information.
Wellness: drank water, painkillers, music.
what I’d like is to count how many times I’ve used “water,” “painkillers,” “music” etc.
my daily note title template is 2022-07-06 – Wednesday for example.
Can this be done easily? If so, how?
Thank you.
I want to create a simple chart from my Daily notes with Dataview and/or DataviewJS.
Can you help me with some sample code, please?
Thank you!
Hi snowbiker100, to make a chart you’ll almost certainly want some additional plugin that makes charts. I know there are several in the community directory. One I have used with dataview fields is obsidian-tracker, which has lots of code examples in an examples dorectory on github, including ones that use dataview fields. Hopefully other folks who have used other chart/graph/data-visualizarion plugins can chime in with advice also!
Do you mean “Obsidian charts” plugin? I’m not directly familiar but this documentation page shows a dataviewjs example. It looks like other pages on that documentation site have an example of a bar chart with multiple bars per day.
A thought independent of the programming: if you put everything on your example diagram on the same chart it is going to be really hard to see the “Fitness” and “Writing” bars because the numbers for “Nutrition” are so big!
Good luck!
@scholarInTraining Thank you so much for your direction. This chart is a good start but it is not aggregating the elements from multiple days. The dataview source is local only to the current page. And yes you are correct long term showing everything on one chart is not practical. I will want to develop weekly and monthly averages for the chart(s). At this first stage, I am trying to keep the chart as simple as possible just bring in the data from multiple daily notes and create a simple chart.
I’m in the process of creating a dictionary of architecture terms and having a blast using dataview(js) for the first time. It makes heavy use of the buttons plugin that pushes data into the YAML as properties.
It automatically generates pages, filters using keywords and properties and can group by different properties. The columns can be enabled and disabled and are all formatted according to their data. One thing I still want to add is a button column that inserts a template into the item, but I will have to figure out how to do that. I’m using some custom css snippets as well to format some stuff a bit neater with subtle animations. The code could definitely be cleaner/ better optimized but its pretty fast up to 500 items per page. Let me know if anyone has questions or tips on optimizing
const self = dv.current();
const definitions = [];
const input_string = self.keyword?.toLowerCase();
const string_array = input_string?.split(` `);
const filter_array = [self.status_filter, self.period_filter, self.category_filter, self.region_filter];
const input_letter = self.letter?.toLowerCase();
const result_amount = self.result_amount;
const pagebuttons = ["`button-page1` ", "`button-page2` ", "`button-page3` ", "`button-page4` ", "`button-page5` ", "`button-page6` ", "`button-page7`", "`button-page8`", "`button-page9`", "`button-page10`", "`button-page11`", "`button-page12`", "`button-page13`", "`button-page14`", "`button-page15`", "`button-page16`", "`button-page17`", "`button-page18`", "`button-page19`", "`button-page20`", "`button-page21`", "`button-page22`", "`button-page23`", "`button-page24`", "`button-page25`"];
function arrayContains(str, filter){
return (str?.split(" ").some(r => filter?.includes(r)) || !filter);
}
const columns = ["Page: " + self.page.toString() + " "];
const visible_columns = {
Status: self.show_status,
Aliases: self.show_aliases,
Definition: self.show_short_definition,
Category: self.show_category,
Period: self.show_timeperiod,
Region: self.show_region,
Tags: self.show_tags,
Created: self.show_created,
Edited: self.show_edited
};
for (const key in visible_columns){
visible_columns[key] && columns.push(key);
}
function splitString(string){
return (string?.toString().split(","));
}
function formatTags(array,value){
const formattedtags = splitString(value);
array.push(formattedtags?.map(a => "#" + a).join(""));
}
function formatAliases(array,value){
const formattedaliases = splitString(value);
array.push(formattedaliases?.map(a => formattedaliases.indexOf(a) + 1 + ". " + a));
}
function formatShortDefinition(array,value){
const formattedshortdefinition = (value ? "_" + value + "_" : "__undefined__");
array.push(formattedshortdefinition);
}
function formatCategory(array,value){
array.push(value);
}
function formatTimePeriod(array,value){
array.push(value);
}
function formatRegion(array,value){
array.push(value);
}
function formatCreated(array,value){
array.push(value);
}
function formatEdited(array,value){
array.push(value);
}
//list all pages from the chosen folder
const pages = dv.pages(self.test_mode == "1" ? ('"TestDefinitions"') : ('"Definitions"')).where(p =>
(
//either the title, description or any of the in-/ outlinks contains
(p.file.name.toLowerCase()?.contains(input_string) && self.use_keyword) || p.file.aliases?.toString().contains(input_string) ||
p.file.outlinks?.toString().toLowerCase().contains(input_string) || p.file.short_definition?.toLowerCase().contains(input_string) ||
p.file.inlinks?.toString().toLowerCase().contains(input_string) || !self.use_keyword) &&
//contains any of the chosen filters
arrayContains(p.period,self.period_filter) &&
arrayContains(p.category,self.category_filter) &&
arrayContains(p.region,self.region_filter) &&
(p.status?.contains(self.status_filter) || !self.status_filter) &&
//first letter starts with chosen letter filter
(p.file.name[0]?.toLowerCase() == input_letter || !input_letter)
);
//creates a text showing the search criteria
const filter_text = ((pages.length == 0 ? "No resullts for: " : (pages.length + " results for : ")) +
((self.use_keyword) ? self.keyword + ", " : "") + filter_array.filter(Boolean).join(", ") + " in " + (self.letter != null ? ("'" + self.letter + "'") : "the database"));
dv.paragraph(filter_text);
//calculate page count for table
const page_count = parseInt(Math.ceil(pages.length / result_amount));
//grouping buttons
dv.span("`button-groupbystatus` `button-groupbyfilled` `button-dontgroup`");
//create a table for every group
for (const group of pages.groupBy(p => ((self.groupby == 1) ? p.status : ((self.groupby == 2) ? p.tags != null : p.False)))) {
dv.paragraph("___");
//group headers
(self.groupby == 1) ? (dv.header(2, (group.key != null ? "Status: "+group.key : "No status"))) : ((self.groupby == 2) && (dv.header(2, (group.key != 1 ? "Unfilled" : "Filled"))));
//generate page numbers
for (let i = 0; i < group.rows.length; i++) {
(i%result_amount==0)&&dv.span(pagebuttons[i/result_amount]);
}
//generate table
dv.table(columns,
group.rows
.sort((c => (self.sortbytime%2>0) ? c.file.ctime.toString() : c.file.mtime.toString()),self.sortbytime<=2?'desc':`asc`)
.map(p => {
const columnsid = [p.file?.link];
self.show_status && columnsid.push(p.status);
self.show_aliases && formatAliases(columnsid,p.aliases);
self.show_short_definition && formatShortDefinition(columnsid,p.short_definition);
self.show_category && formatCategory(columnsid,p.category);
self.show_timeperiod && formatTimePeriod(columnsid,p.period);
self.show_region && formatRegion(columnsid,p.region);
self.show_tags && formatTags(columnsid,p.tags);
self.show_created && formatCreated(columnsid,p.file.ctime);
self.show_edited && formatEdited(columnsid,p.file.mtime);
return columnsid;
})
//show results per page
.slice(result_amount * (self.page) - result_amount, result_amount * (self.page))
);
}
I have some data with the following formats.
Side_A:: 2
Side_a:: 33
Side_B::444
Side_b:: 5555
Side_A:: 1
Side_a::22
Side_B::333
Side_b:: 4444
Side_A:: 5
Side_a::11
Side_B::222
Side_b:: 3333
let transpose = m => m[0].map((x,i) => m.map(x => x[i]));
let p = dv.pages('""')
let result = transpose([p.Side_A, p.Side_a, p.Side_B, p.Side_b])
// result = result.filter(x=>x[0] && x[1].contains(""))
dv.table(["A", "a", "B", "b"], result)
With this code, I succeeded in getting the data table.
A | a | B | b |
---|---|---|---|
2 | 33 | 444 | 5555 |
1 | 22 | 333 | 4444 |
5 | 11 | 222 | 3333 |
Now, I’d like to get this table sorted according to A or B.
It would be very thankful if someone can give me a tip.
Add this before the dv.table line to sort by A:
result.values.sort((a, b) => a[0] - b[0])
Add this to sort by B:
result.values.sort((a, b) => a[2] - b[2])
@scholarInTraining thank you so much for your direction. I have been “playing” with the dataview, dataviewjs, and chart plugin. However, I do not see any examples of this idea of a simple chart. I am also hoping (as you) that other folks can provide a simple example. The “Dataview Simple Chart” is a missing link.
They work perfectly for my purpose.
Thank you very much.
Hi @snowbiker100 check out the screenshot in this thread from @metawops - below the code that is giving metawops an issue looks like a chart example. Maybe @metawops can help with your chart questions!
I’m sure we can work things out here, @snowbiker100.
As @scholarInTraining pointed out I have a rather simple chart inside of one of my notes that shows me the development of the downloads of my “Table to CSV exporter” plugin.
Because the data I want to visualize her resides in a JSON file of some sort/syntax I have to use a dataviewjs
block rather than a dataview
block because I have to read in the data from the JSON file it’s in and extract the x-axis (called labels
in chart.js – on which the plugin “Obsidian Charts” is based) and y-axis data.
Here’s a screenshot of the dataviewjs
source left and the result with the “Obsidian Charts” plugin on the right.
If I change the chart type to bar
I get a bar chart of the same data like this:
Your data has to be simply inside of a JavaScript array if you use a dataviewjs
block.
btw, the “Obsidian Charts” documentation is rather sparse and I find myself often on chartjs.org to learn more about all the options & possibilities. Browsing the samples there helps me, too.
If you have multiple data sets you’d have to add a 2nd, 3rd, … set to the datasets
array – in my case that’s inside the const data
structure. Each dataset is a dictionary and should at least contain a label
(x-axis) and data
(y-axis) key with arrays as values, respectively.
Does this help a bit? Don’t be shy to ask more questions! We’ll get there eventually!
@scholarInTraining Thank you so much for your continued help. I really appreciate it. These charts are exactly the type I could love to create. However, I want to load data from the markdown files in my vault. It looks like @metawops is loading data from a local JSON file. Especially I want to “Select Sum(Calorie) as CalorieTotal from all my MD Files Group by date.” Then have the types of charts @metawops had developed. That would be so wonderful. If you have any other ideas please let me know. Thank you, so much @scholarInTraining